Legend Fontsize in Matplotlib
In Matplotlib, legends are used to label various elements on a plot. These elements could include lines, markers, or other shapes that represent data on the plot. Legends are crucial for making plots more readable and informative. One important aspect of legends is the font size, which determines how easily the labels can be read.
In this article, we will explore how to customize the font size of legends in Matplotlib. We will go through various examples and demonstrate how to adjust the legend font size to suit your needs.
Example 1: Set Legend Fontsize
import matplotlib.pyplot as plt

plt.plot([1, 2, 3, 4], label='Line 1')
plt.plot([4, 3, 2, 1], label='Line 2')
plt.legend(fontsize=12)
plt.show()
Output:
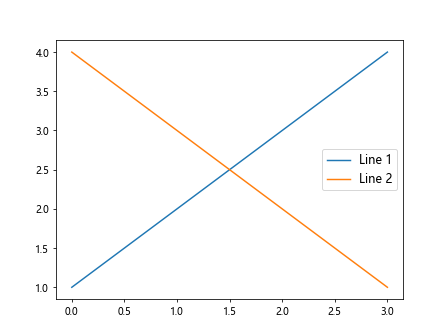
In this example, we set the legend font size to 12 using the fontsize parameter in the legend() function. This will increase the font size of the legend on the plot.
Example 2: Increase Legend Fontsize
import matplotlib.pyplot as plt

plt.plot([1, 2, 3, 4], label='Line 1')
plt.plot([4, 3, 2, 1], label='Line 2')
plt.legend(fontsize=14)
plt.show()
Output:
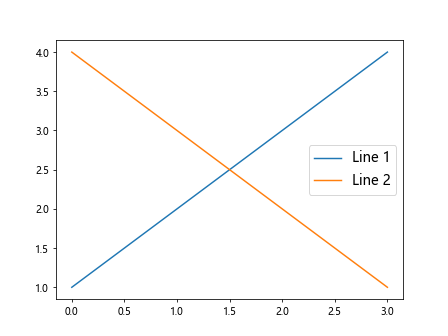
Here, we have increased the font size of the legend to 14. You can adjust the font size to make the legend more prominent or match the overall plot aesthetics.
Example 3: Decrease Legend Fontsize
import matplotlib.pyplot as plt

plt.plot([1, 2, 3, 4], label='Line 1')
plt.plot([4, 3, 2, 1], label='Line 2')
plt.legend(fontsize=10)
plt.show()
Output:
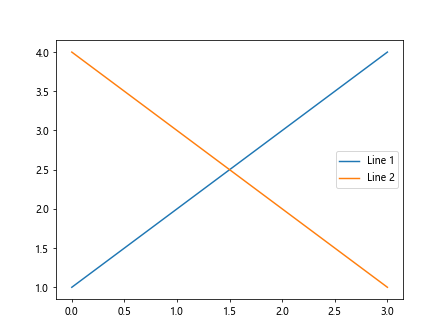
Conversely, decreasing the font size of the legend to 10 can help fit more information in a smaller space or create a more subtle appearance.
Example 4: Legend Fontsize with Default Parameters
import matplotlib.pyplot as plt

plt.plot([1, 2, 3, 4], label='Line 1')
plt.plot([4, 3, 2, 1], label='Line 2')
plt.legend()
plt.show()
Output:
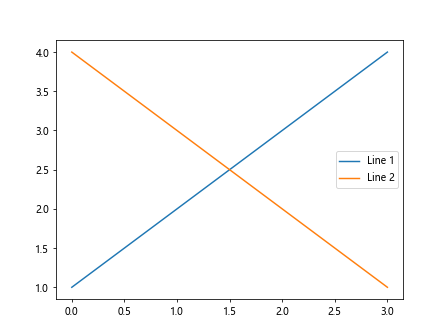
If you do not specify the fontsize parameter, Matplotlib will use the default font size for the legend. This can vary depending on the Matplotlib style or configuration.
Example 5: Legend Title Fontsize
import matplotlib.pyplot as plt

plt.plot([1, 2, 3, 4], label='Line 1')
plt.plot([4, 3, 2, 1], label='Line 2')
plt.legend(title='Legend Title', title_fontsize=14)
plt.show()
Output:
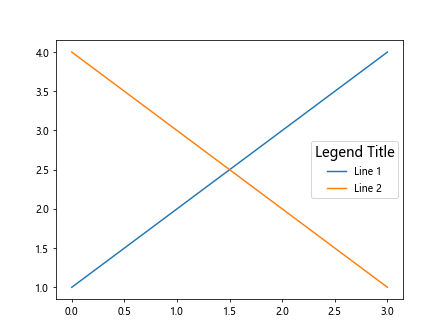
In this example, we are setting the font size of the legend title to 14 using the title_fontsize parameter. This can help distinguish the legend title from the rest of the labels.
Example 6: Legend Title with Default Fontsize
import matplotlib.pyplot as plt

plt.plot([1, 2, 3, 4], label='Line 1')
plt.plot([4, 3, 2, 1], label='Line 2')
plt.legend(title='Legend Title')
plt.show()
Output:
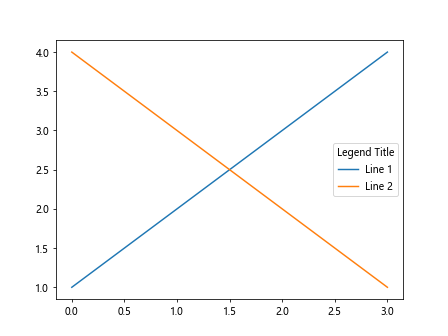
If you do not specify the title_fontsize parameter, the legend title will inherit the default font size for legends.
Example 7: Legend Fontsize with Matplotlib Styles
import matplotlib.pyplot as plt

plt.style.use('seaborn-darkgrid')
plt.plot([1, 2, 3, 4], label='Line 1')
plt.plot([4, 3, 2, 1], label='Line 2')
plt.legend(fontsize=12)
plt.show()
When using Matplotlib styles, the legend font size will be affected by the style’s settings. You can override this by explicitly setting the font size as shown in this example.
Example 8: Legend Fontsize for Bar Chart
import matplotlib.pyplot as plt

plt.bar([1, 2, 3, 4], [10, 20, 15, 25], label='Bars')
plt.legend(fontsize=12)
plt.show()
Output:
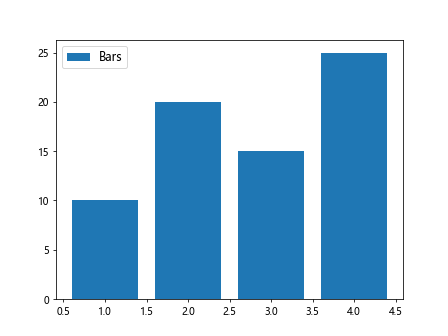
Legends are not limited to line plots; you can also add legends to other types of plots like bar charts. Adjusting the font size for a bar chart legend follows the same principles.
Example 9: Customize Legend Fontsize in Subplots
import matplotlib.pyplot as plt

fig, axs = plt.subplots(2)
fig.suptitle('Subplots with Customized Legends')

axs[0].plot([1, 2, 3, 4], label='Line 1')
axs[1].plot([4, 3, 2, 1], label='Line 2')

axs[0].legend(fontsize=12)
axs[1].legend(fontsize=14)

plt.show()
Output:
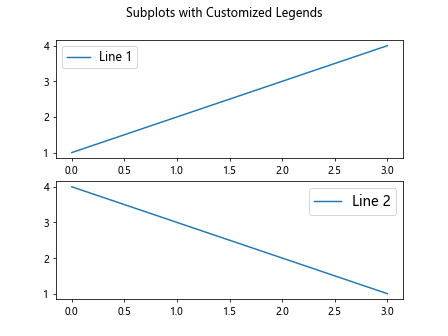
When working with subplots, you can customize the legend font size for each subplot independently. This example demonstrates how to set different font sizes for legends in two subplots.
Example 10: Legend Fontsize in Scatter Plot
import matplotlib.pyplot as plt

plt.scatter([1, 2, 3, 4], [10, 15, 20, 25], label='Points')
plt.legend(fontsize=12)
plt.show()
Output:
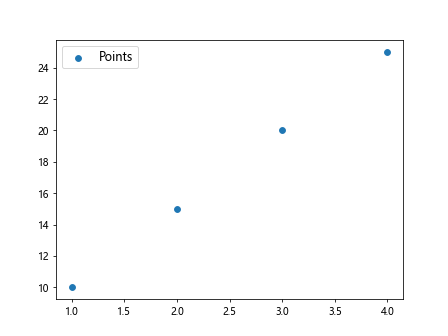
Scatter plots can also benefit from legends to indicate different groups of data points. Setting the font size for a legend in a scatter plot is similar to other plot types.
Example 11: Larger Legend Fontsize for Visibility
import matplotlib.pyplot as plt

plt.plot([1, 2, 3, 4], label='Line 1')
plt.plot([4, 3, 2, 1], label='Line 2')
plt.legend(fontsize=16)
plt.show()
Output:
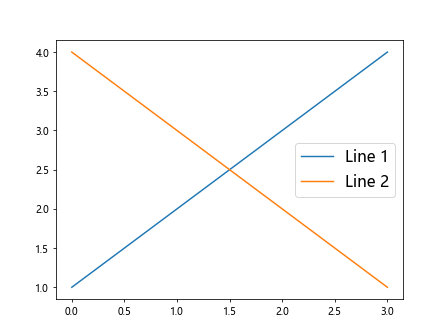
Increasing the font size of the legend can improve visibility, especially when the plot contains many elements or when the plot is small.
Example 12: Smaller Legend Fontsize for Clarity
import matplotlib.pyplot as plt

plt.plot([1, 2, 3, 4], label='Line 1')
plt.plot([4, 3, 2, 1], label='Line 2')
plt.legend(fontsize=10)
plt.show()
Output:
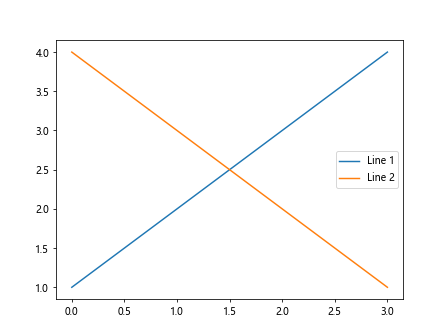
Conversely, decreasing the font size of the legend can improve clarity when the plot is crowded with information.
Example 13: Using LaTeX in Legend Font
import matplotlib.pyplot as plt

plt.plot([1, 2, 3, 4], label=r'$\frac{a}{b}$')
plt.plot([4, 3, 2, 1], label='Line 2')
plt.legend(fontsize=12)
plt.show()
Output:
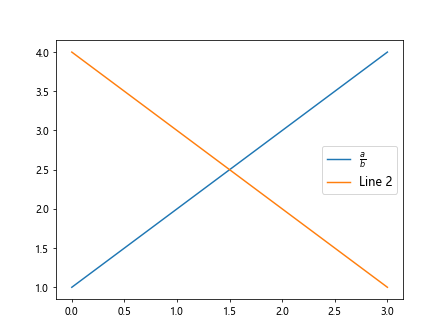
You can use LaTeX in legend labels to add mathematical symbols or equations. The font size of LaTeX content in legends can also be customized.
Example 14: Bold Font for Legend
import matplotlib.pyplot as plt

plt.plot([1, 2, 3, 4], label='Line 1')
plt.plot([4, 3, 2, 1], label='Line 2')
plt.legend(fontsize=12, fontweight='bold')
plt.show()
Applying bold font to the legend can help highlight the labels and make them stand out on the plot.
Example 15: Italic Font for Legend
import matplotlib.pyplot as plt

plt.plot([1, 2, 3, 4], label='Line 1')
plt.plot([4, 3, 2, 1], label='Line 2')
plt.legend(fontsize=12, fontstyle='italic')
plt.show()
Similarly, using italic font for the legend labels can add emphasis or indicate special information on the plot.
Example 16: Setting Legend Font to Sans-Serif
import matplotlib.pyplot as plt

plt.plot([1, 2, 3, 4], label='Line 1')
plt.plot([4, 3, 2, 1], label='Line 2')
plt.legend(fontsize=12, fontfamily='sans-serif')
plt.show()
Changing the font family of the legend to a sans-serif font can enhance the readability of the labels, especially in plots with small text sizes.
Example 17: Adjust Legend Font Properties
import matplotlib.pyplot as plt
from matplotlib.font_manager import FontProperties

font = FontProperties()
font.set_family('serif')
font.set_style('italic')
font.set_size(14)

plt.plot([1, 2, 3, 4], label='Line 1')
plt.plot([4, 3, 2, 1], label='Line 2')
plt.legend(prop=font)
plt.show()
Output:
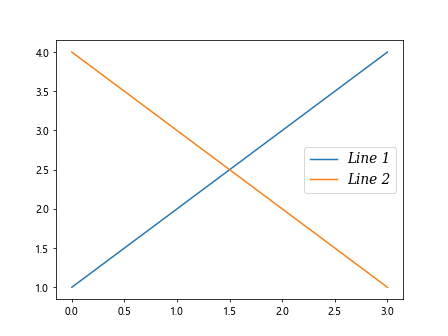
You can further customize the font properties of the legend by creating a FontProperties object and setting various attributes such as family, style, and size.
Example 18: Legend Fontsize in Polar Plot
import matplotlib.pyplot as plt

fig = plt.figure()
ax = fig.add_subplot(111, polar=True)
ax.plot([0, 1, 2, 3, 4], [1, 2, 3, 4, 5], label='Data')
ax.legend(fontsize=12)
plt.show()
Output:
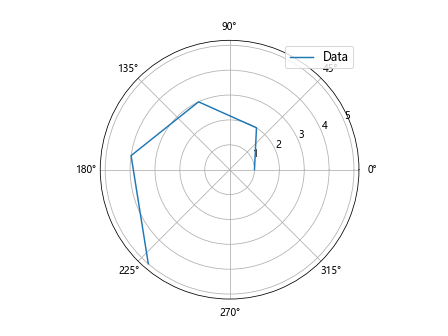
When working with polar plots, you can also add legends to provide additional context. Setting the font size for legends in polar plots follows the same principles as other types of plots.
Example 19: Legend Fontsize in 3D Plot
import matplotlib.pyplot as plt
from mpl_toolkits.mplot3d import Axes3D

fig = plt.figure()
ax = fig.add_subplot(111, projection='3d')
ax.plot([1, 2, 3, 4], [5, 6, 7, 8], [2, 3, 4, 5], label='Line')
ax.legend(fontsize=12)
plt.show()
Output:
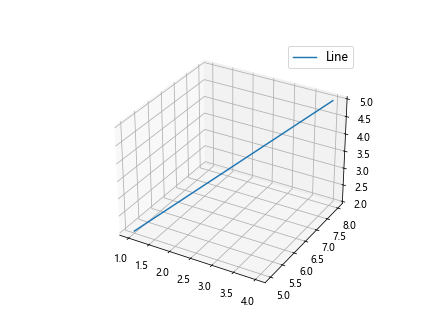
In 3D plots, legends can help distinguish between different elements or datasets. Adjusting the font size for legends in 3D plots is similar to 2D plots.
Conclusion
Customizing the font size of legends in Matplotlib allows you to improve the readability and aesthetics of your plots. By adjusting the font size, you can make the legends more prominent or subtle, depending on your preferences. Experimenting with different font sizes and styles can help you create visually appealing and informative plots.
In this article, we covered various examples of changing the legend font size in Matplotlib, including setting a specific font size, adjusting the font size for legends in different types of plots, and customizing font properties. By applying these techniques to your plots, you can enhance the presentation of your data and make your visualizations more effective.