Legend Size in Matplotlib
Matplotlib is a popular Python library for creating static, animated, and interactive visualizations in Python. Legends in Matplotlib provide a key for all the elements of the plot. In this article, we will explore how to adjust the size of the legend in Matplotlib to make our plots more readable and visually appealing.
Adjusting Legend Size
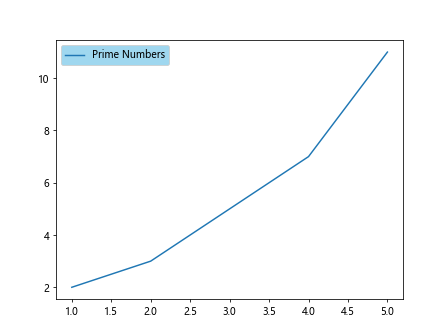
Example 1: Basic legend with default size
import matplotlib.pyplot as plt

x = [1, 2, 3, 4, 5]
y = [2, 3, 5, 7, 11]

plt.plot(x, y, label='Prime Numbers')
plt.legend()
plt.show()
Output:

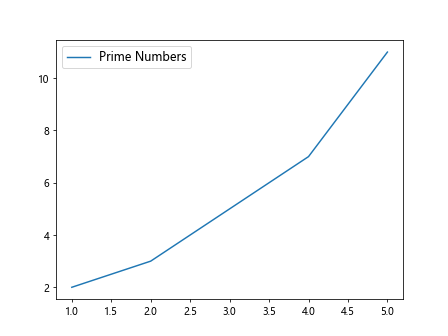
Example 2: Increasing legend size
import matplotlib.pyplot as plt

x = [1, 2, 3, 4, 5]
y = [2, 3, 5, 7, 11]

plt.plot(x, y, label='Prime Numbers')
plt.legend(prop={'size': 15})
plt.show()
Output:
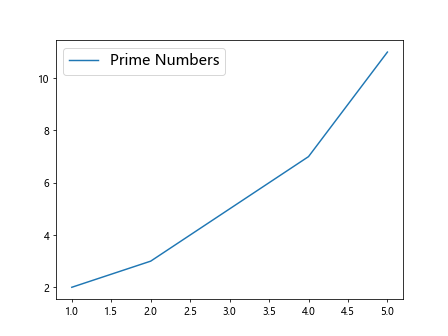
In Example 1, we have a basic legend with the default size. In Example 2, we have increased the size of the legend using the prop parameter to make it more visible.
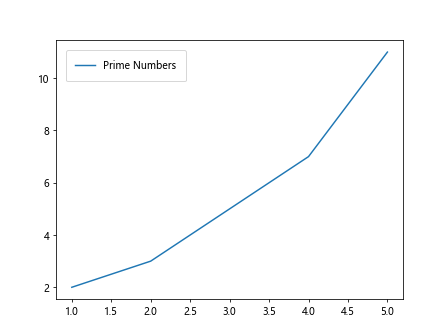
Example 3: Changing legend font size
import matplotlib.pyplot as plt

x = [1, 2, 3, 4, 5]
y = [2, 3, 5, 7, 11]

plt.plot(x, y, label='Prime Numbers')
plt.legend(fontsize=12)
plt.show()
Output:
Example 4: Setting legend title size
import matplotlib.pyplot as plt

x = [1, 2, 3, 4, 5]
y = [2, 3, 5, 7, 11]

plt.plot(x, y, label='Prime Numbers')
plt.legend(title='Legend', title_fontsize=14)
plt.show()
Output:
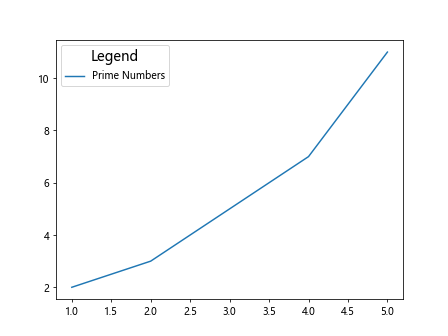
In Example 3, we changed the font size of the legend text. In Example 4, we set the title of the legend and adjusted its size.
Example 5: Customizing legend box
import matplotlib.pyplot as plt

x = [1, 2, 3, 4, 5]
y = [2, 3, 5, 7, 11]

plt.plot(x, y, label='Prime Numbers')
plt.legend(borderpad=1, borderaxespad=1, loc='upper left')
plt.show()
Output:
Example 6: Changing legend background color
import matplotlib.pyplot as plt

x = [1, 2, 3, 4, 5]
y = [2, 3, 5, 7, 11]

plt.plot(x, y, label='Prime Numbers')
plt.legend(facecolor='skyblue')
plt.show()
Output:
In Example 5, we customized the legend box by adjusting the padding and location. In Example 6, we changed the background color of the legend to make it stand out.
Advanced Legend Customization
Example 7: Modifying legend label spacing
import matplotlib.pyplot as plt

x = [1, 2, 3, 4, 5]
y = [2, 3, 5, 7, 11]

plt.plot(x, y, label='Prime Numbers')
plt.legend(labelspacing=1.5)
plt.show()
Output:

Example 8: Adjusting legend item height
import matplotlib.pyplot as plt

x = [1, 2, 3, 4, 5]
y = [2, 3, 5, 7, 11]

plt.plot(x, y, label='Prime Numbers')
plt.legend(handleheight=2)
plt.show()
Output:

In Example 7, we modified the spacing between legend labels. In Example 8, we adjusted the height of the legend items.
Example 9: Changing legend title position
import matplotlib.pyplot as plt

x = [1, 2, 3, 4, 5]
y = [2, 3, 5, 7, 11]

plt.plot(x, y, label='Prime Numbers')
plt.legend(title='Legend', title_loc='left')
plt.show()
Example 10: Rotating legend labels
import matplotlib.pyplot as plt

x = [1, 2, 3, 4, 5]
y = [2, 3, 5, 7, 11]

plt.plot(x, y, label='Prime Numbers')
plt.legend(labelrotation=45)
plt.show()
In Example 9, we changed the position of the legend title to the left. In Example 10, we rotated the legend labels by 45 degrees for better readability.
Conclusion
Adjusting the size of the legend in Matplotlib can greatly enhance the appearance of your plots. By customizing various aspects of the legend, such as size, font, color, and spacing, you can create professional-looking visualizations that effectively communicate your data. Experiment with the examples provided in this article to find the best settings for your plots.