Label Size in Matplotlib
Matplotlib is a popular Python library used for creating visualizations such as charts, plots, and graphs. When creating visualizations, it is important to pay attention to details such as label size in order to ensure that the final output is both aesthetically pleasing and informative.
In this article, we will explore different ways to adjust the label size in Matplotlib to customize the appearance of our plots. We will cover various methods and techniques that can be used to change the size of labels on the x-axis, y-axis, and plot title.
Let’s dive into some examples of how we can adjust the label size in Matplotlib:
Adjusting X-Axis Label Size
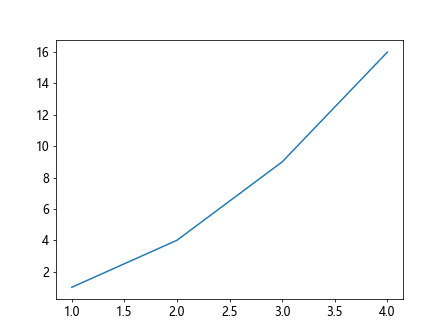
One way to adjust the size of the x-axis labels in Matplotlib is by using the tick_params method. This method allows us to specify the size of the x-axis labels using the labelsize parameter.
import matplotlib.pyplot as plt

plt.plot([1, 2, 3, 4], [1, 4, 9, 16])
plt.xlabel('X-axis label', fontsize=12)
plt.ylabel('Y-axis label', fontsize=12)
plt.xticks(fontsize=10)
plt.show()
Output:
Adjusting Y-Axis Label Size
Similarly, we can adjust the size of the y-axis labels by using the tick_params method with the labelsize parameter.
import matplotlib.pyplot as plt

plt.plot([1, 2, 3, 4], [1, 4, 9, 16])
plt.xlabel('X-axis label', fontsize=12)
plt.ylabel('Y-axis label', fontsize=12)
plt.yticks(fontsize=10)
plt.show()
Output:

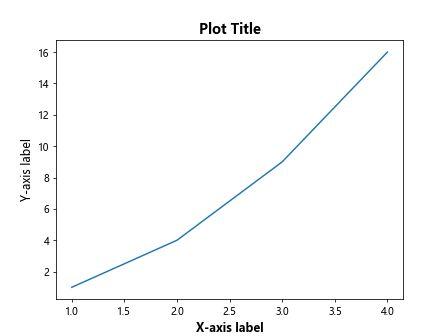
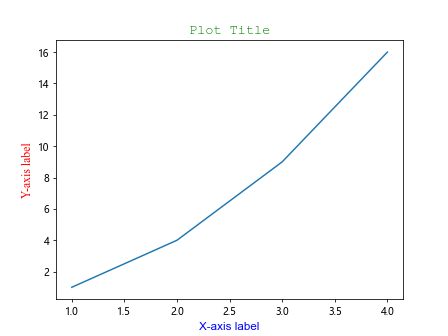
Adjusting Plot Title Size
To adjust the size of the plot title in Matplotlib, we can use the title method along with the fontsize parameter.
import matplotlib.pyplot as plt

plt.plot([1, 2, 3, 4], [1, 4, 9, 16])
plt.xlabel('X-axis label', fontsize=12)
plt.ylabel('Y-axis label', fontsize=12)
plt.title('Plot Title', fontsize=14)
plt.show()
Output:
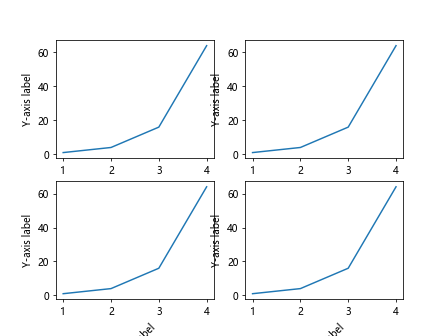
Customizing Label Size for Subplots
If you are working with subplots in Matplotlib, you can customize the label size for each subplot individually. Here is an example of how to do this:
import matplotlib.pyplot as plt

fig, axs = plt.subplots(2, 2)

for ax in axs.flat:
    ax.plot([1, 2, 3, 4], [1, 4, 16, 64])
    ax.set_xlabel('X-axis label', fontsize=10)
    ax.set_ylabel('Y-axis label', fontsize=10)

plt.show()
Output:
Changing Default Label Size
In Matplotlib, the default label size for axes and titles can be changed by modifying the rcParams dictionary. Here’s how you can do this:
import matplotlib.pyplot as plt
import matplotlib as mpl

mpl.rcParams['axes.labelsize'] = 14
mpl.rcParams['xtick.labelsize'] = 12
mpl.rcParams['ytick.labelsize'] = 12
mpl.rcParams['axes.titlesize'] = 16

plt.plot([1, 2, 3, 4], [1, 4, 9, 16])
plt.xlabel('X-axis label')
plt.ylabel('Y-axis label')
plt.title('Plot Title')
plt.show()
Output:
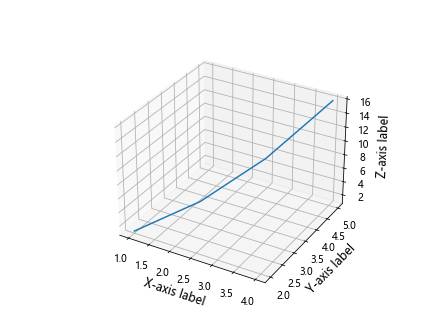
Adjusting Label Size in 3D Plots
For 3D plots in Matplotlib, we can adjust the size of the labels using the tick_params method just like in 2D plots. Here’s an example:
import matplotlib.pyplot as plt
from mpl_toolkits.mplot3d import Axes3D

fig = plt.figure()
ax = fig.add_subplot(111, projection='3d')
X = [1, 2, 3, 4]
Y = [2, 3, 4, 5]
Z = [1, 4, 9, 16]

ax.plot(X, Y, Z)

plt.xlabel('X-axis label', fontsize=12)
plt.ylabel('Y-axis label', fontsize=12)
ax.set_zlabel('Z-axis label', fontsize=12)

plt.show()
Output:
Adjusting Tick Label Size
By default, Matplotlib also provides a way to adjust the size of tick labels on both the x and y axes. Here’s an example:
import matplotlib.pyplot as plt

plt.plot([1, 2, 3, 4], [1, 4, 9, 16])
plt.xticks(fontsize=12)
plt.yticks(fontsize=12)
plt.show()
Output:
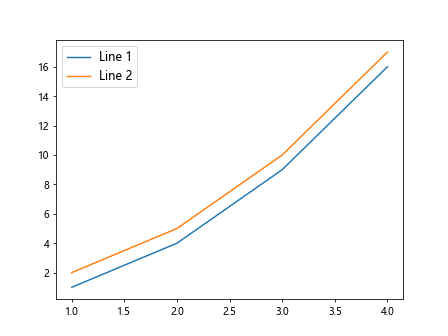
Adjusting Label Size for Specific Plots
In some cases, you may want to adjust the label size for specific plots within a larger visualization. This can be achieved by setting the fontsize parameter for each individual label.
import matplotlib.pyplot as plt

plt.plot([1, 2, 3, 4], [1, 4, 9, 16], label='Line 1')
plt.plot([1, 2, 3, 4], [2, 5, 10, 17], label='Line 2')
plt.legend(fontsize=12)
plt.show()
Output:
Adjusting Font Weight
In addition to adjusting the size of labels in Matplotlib, you can also modify the font weight to make the labels bold or italic. Here’s an example of how to change the font weight:
import matplotlib.pyplot as plt

plt.plot([1, 2, 3, 4], [1, 4, 9, 16])
plt.xlabel('X-axis label', fontsize=12, fontweight='bold')
plt.ylabel('Y-axis label', fontsize=12, fontweight='normal')
plt.title('Plot Title', fontsize=14, fontweight='bold')
plt.show()
Output:
Adjusting Label Color and Font Family
Another way to customize the appearance of labels in Matplotlib is by changing the font color and font family. Here’s an example showing how to adjust these properties:
import matplotlib.pyplot as plt

plt.plot([1, 2, 3, 4], [1, 4, 9, 16])
plt.xlabel('X-axis label', fontsize=12, color='blue', fontname='Arial')
plt.ylabel('Y-axis label', fontsize=12, color='red', fontname='Times New Roman')
plt.title('Plot Title', fontsize=14, color='green', fontname='Courier New')
plt.show()
Output:
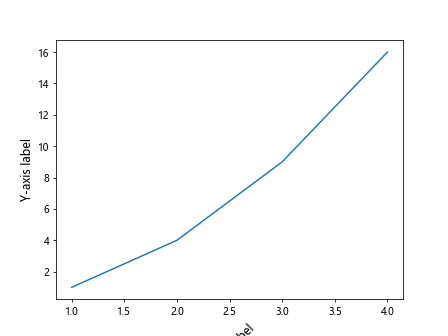
Adjusting Label Rotation
In some cases, you may need to rotate the labels on the x-axis or y-axis for better visibility. This can be done by setting the rotation parameter. Here’s an example of how to rotate the labels:
import matplotlib.pyplot as plt

plt.plot([1, 2, 3, 4], [1, 4, 9, 16])
plt.xlabel('X-axis label', fontsize=12, rotation=45)
plt.ylabel('Y-axis label', fontsize=12, rotation=90)
plt.show()
Output:
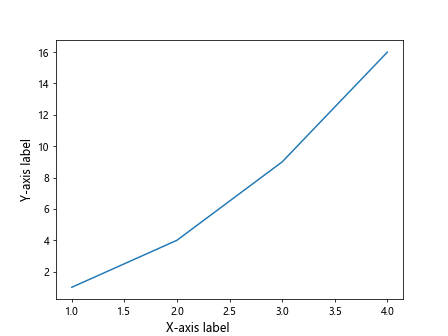
Adjusting Label Padding
You can also adjust the padding around the labels in Matplotlib to improve spacing and readability. This can be done by setting the labelpad parameter. Here’s an example:
import matplotlib.pyplot as plt

plt.plot([1, 2, 3, 4], [1, 4, 9, 16])
plt.xlabel('X-axis label', fontsize=12, labelpad=10)
plt.ylabel('Y-axis label', fontsize=12, labelpad=5)
plt.show()
Output:

Adjusting Label Alignment
To change the alignment of labels in Matplotlib, you can use the ha and va parameters to specify horizontal and vertical alignment. Here’s an example demonstrating label alignment:
import matplotlib.pyplot as plt

plt.plot([1, 2, 3, 4], [1, 4, 9, 16])
plt.xlabel('X-axis label', fontsize=12, ha='right', va='top')
plt.ylabel('Y-axis label', fontsize=12, ha='center', va='bottom')
plt.show()
Output:
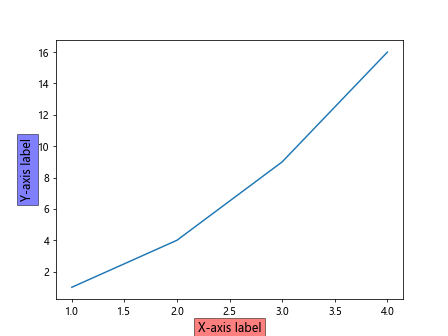
Adjusting Label Background Color
In Matplotlib, you can also customize the backgroundcolor of the labels to make them stand out against the plot background. This can be done by setting the bbox parameter. Here’s an example of how to adjust the label background color:
import matplotlib.pyplot as plt

plt.plot([1, 2, 3, 4], [1, 4, 9, 16])
plt.xlabel('X-axis label', fontsize=12, bbox=dict(facecolor='red', alpha=0.5))
plt.ylabel('Y-axis label', fontsize=12, bbox=dict(facecolor='blue', alpha=0.5))
plt.show()
Output:
Adjusting Label Rotation in Subplots
When working with subplots in Matplotlib, you may need to rotate the labels in each subplot individually. This can be achieved by setting the rotation parameter for each individual label. Here’s an example:
import matplotlib.pyplot as plt

fig, axs = plt.subplots(2, 2)

for ax in axs.flat:
    ax.plot([1, 2, 3, 4], [1, 4, 16, 64])
    ax.set_xlabel('X-axis label', fontsize=10, rotation=45)
    ax.set_ylabel('Y-axis label', fontsize=10, rotation=90)

plt.show()
Output:
Adjusting Label Size for Pie Charts
For pie charts in Matplotlib, you can adjust the size of the labels using the fontsize parameter within the pie function. Here’s an example of how to customize labels in a pie chart:
import matplotlib.pyplot as plt

labels = ['A', 'B', 'C', 'D']
sizes = [25, 35, 20, 20]

plt.pie(sizes, labels=labels, autopct='%1.1f%%', startangle=90, fontsize=12)
plt.axis('equal')
plt.show()
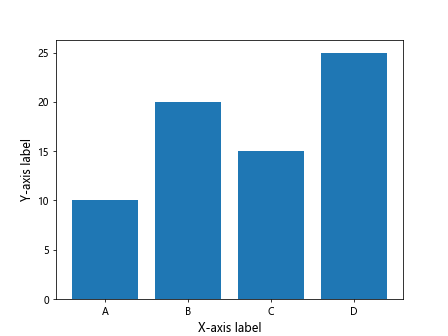
Adjusting Label Size for Bar Charts
In bar charts, you can change the size of the x-axis and y-axis labels using the tick_params method. Here’s an example demonstrating how to adjust label size in a bar chart:
import matplotlib.pyplot as plt

labels = ['A', 'B', 'C', 'D']
values = [10, 20, 15, 25]

plt.bar(labels, values)
plt.xlabel('X-axis label', fontsize=12)
plt.ylabel('Y-axis label', fontsize=12)
plt.xticks(fontsize=10)
plt.yticks(fontsize=10)
plt.show()
Output:
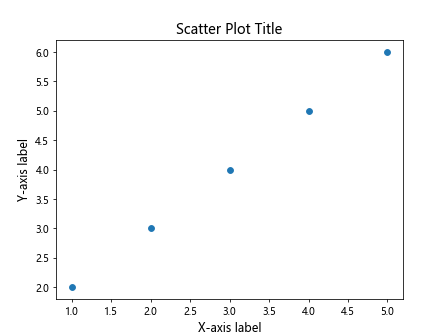
Adjusting Label Size for Scatter Plots
In scatter plots, you can customize the size of the labels for the x-axis, y-axis, and plot title. Here’s an example showing how to adjust label size in a scatter plot:
import matplotlib.pyplot as plt

x = [1, 2, 3, 4, 5]
y = [2, 3, 4, 5, 6]

plt.scatter(x, y)
plt.xlabel('X-axis label', fontsize=12)
plt.ylabel('Y-axis label', fontsize=12)
plt.title('Scatter Plot Title', fontsize=14)
plt.show()
Output:
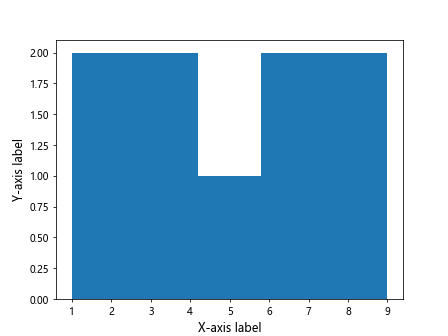
Adjusting Label Size for Histograms
For histograms in Matplotlib, you can change the size of the x-axis and y-axis labels using the xlabel and ylabel functions. Here’s an example demonstrating how to adjust label size in a histogram:
import matplotlib.pyplot as plt

data = [1, 2, 3, 4, 5, 6, 7, 8, 9]

plt.hist(data, bins=5)
plt.xlabel('X-axis label', fontsize=12)
plt.ylabel('Y-axis label', fontsize=12)
plt.show()
Output:
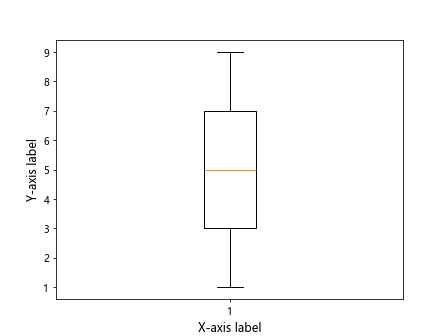
Adjusting Label Size for Box Plots
In box plots, you can adjust the size of the x-axis and y-axis labels using the xlabel and ylabel functions. Here’s an example of how to customize labels in a box plot:
import matplotlib.pyplot as plt

data = [1, 2, 3, 4, 5, 6, 7, 8, 9]

plt.boxplot(data)
plt.xlabel('X-axis label', fontsize=12)
plt.ylabel('Y-axis label', fontsize=12)
plt.show()
Output:
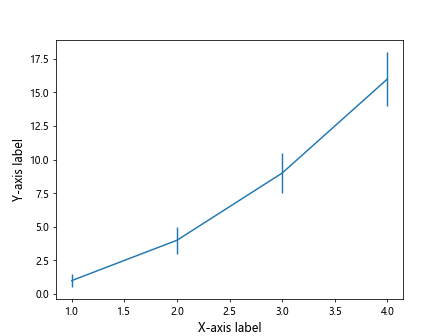
Adjusting Label Size for Error Bars
For plots with error bars in Matplotlib, you can change the size of the labels using the xlabel and ylabel functions. Here’s an example showing how to adjust label size in a plot with error bars:
import matplotlib.pyplot as plt

x = [1, 2, 3, 4]
y = [1, 4, 9, 16]
errors = [0.5, 1, 1.5, 2]

plt.errorbar(x, y, yerr=errors)
plt.xlabel('X-axis label', fontsize=12)
plt.ylabel('Y-axis label', fontsize=12)
plt.show()
Output:
Conclusion
In this article, we have explored various methods for adjusting the label size in Matplotlib. By customizing the size of labels on the x-axis, y-axis, plot title, and other elements, you can create visually appealing and informative visualizations. Experiment with the different techniques provided here to enhance the appearance of your plots and make them more engaging for your audience.