Label Scatter Points in Matplotlib
In data visualization, scatter plots are commonly used to visualize the relationship between two variables. Sometimes, it can be useful to label specific data points on a scatter plot to provide additional information or context. In this article, we will explore how to label scatter points in Matplotlib, a popular Python library for creating static, interactive, and animated plots.
Basic Scatter Plot with Labels
Let’s start by creating a basic scatter plot with some labeled data points using Matplotlib.
import matplotlib.pyplot as plt

# Data
x = [1, 2, 3, 4, 5]
y = [2, 3, 5, 7, 11]
labels = ['A', 'B', 'C', 'D', 'E']

# Create a scatter plot
plt.scatter(x, y)

# Add labels to the data points
for i, txt in enumerate(labels):
    plt.annotate(txt, (x[i], y[i]))

plt.show()
Output:
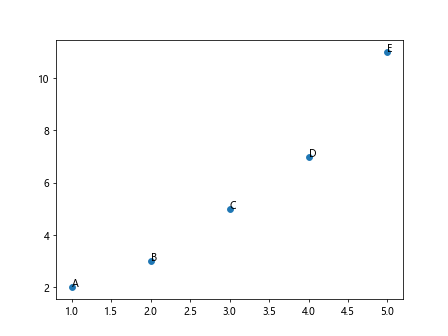
In this example, we have created a simple scatter plot and labeled each point with the corresponding label from the labels list.
Customizing Labels
You can customize the appearance of the labels by changing the font size, color, and style. Let’s see how to do this in Matplotlib.
import matplotlib.pyplot as plt

# Data
x = [1, 2, 3, 4, 5]
y = [2, 3, 5, 7, 11]
labels = ['A', 'B', 'C', 'D', 'E']

# Create a scatter plot
plt.scatter(x, y)

# Customize labels
for i, txt in enumerate(labels):
    plt.annotate(txt, (x[i], y[i]), fontsize=12, color='red', fontstyle='italic')

plt.show()
Output:
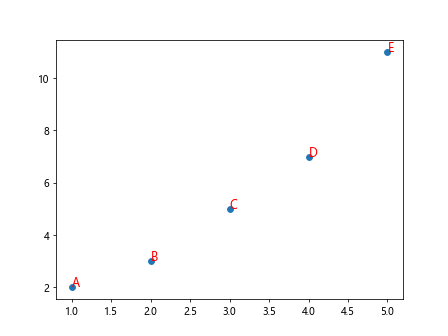
In this code snippet, we have customized the labels by changing the font size, color to red, and style to italic.
Labeling Specific Data Points
You may want to label only specific data points instead of all of them. Let’s see how to label specific data points on a scatter plot in Matplotlib.
import matplotlib.pyplot as plt

# Data
x = [1, 2, 3, 4, 5]
y = [2, 3, 5, 7, 11]
labels = ['A', 'B', 'C', 'D', 'E']
highlight = [2, 4]

# Create a scatter plot
plt.scatter(x, y)

# Add labels to specific data points
for i in highlight:
    plt.annotate(labels[i], (x[i], y[i]))

plt.show()
Output:
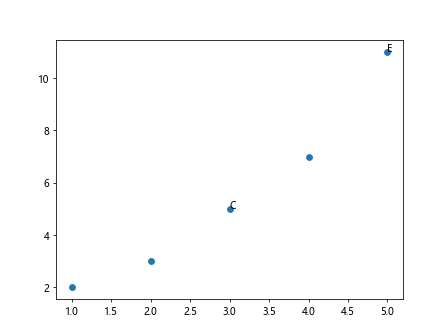
In this example, we have labeled only specific data points indicated by the highlight list.
Adding Arrows to Labels
You can add arrows to the labels pointing towards the corresponding data points to enhance readability. Let’s see how to add arrows to labeled data points in Matplotlib.
import matplotlib.pyplot as plt

# Data
x = [1, 2, 3, 4, 5]
y = [2, 3, 5, 7, 11]
labels = ['A', 'B', 'C', 'D', 'E']

# Create a scatter plot
plt.scatter(x, y)

# Add labels with arrows to data points
for i, txt in enumerate(labels):
    plt.annotate(txt, (x[i], y[i]), xytext=(x[i] + 0.1, y[i] + 0.1), arrowprops=dict(arrowstyle='->'))

plt.show()
Output:
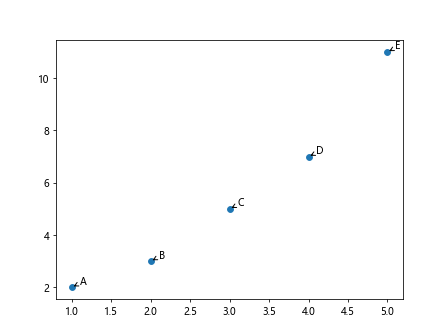
In this code snippet, we have added arrows to the labels pointing towards the corresponding data points for better visualization.
Rotating Labels
Sometimes, you may need to rotate the labels for better alignment with the data points. Let’s see how to rotate labels on a scatter plot in Matplotlib.
import matplotlib.pyplot as plt

# Data
x = [1, 2, 3, 4, 5]
y = [2, 3, 5, 7, 11]
labels = ['A', 'B', 'C', 'D', 'E']

# Create a scatter plot
plt.scatter(x, y)

# Rotate labels
for i, txt in enumerate(labels):
    plt.annotate(txt, (x[i], y[i]), rotation=45)

plt.show()
Output:
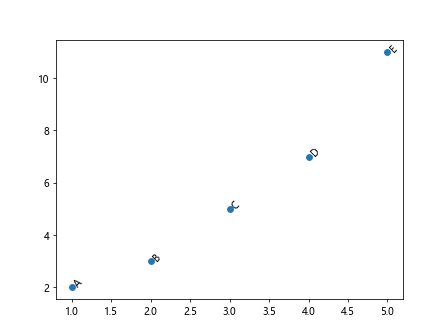
In this example, we have rotated the labels by 45 degrees to align them better with the data points.
Labeling with Data Values
Instead of using predefined labels, you can also label the data points with their corresponding values. Let’s see how to label scatter points with data values in Matplotlib.
import matplotlib.pyplot as plt

# Data
x = [1, 2, 3, 4, 5]
y = [2, 3, 5, 7, 11]

# Create a scatter plot
plt.scatter(x, y)

# Label points with data values
for i in range(len(x)):
    plt.annotate(f'({x[i]}, {y[i]})', (x[i], y[i]))

plt.show()
Output:
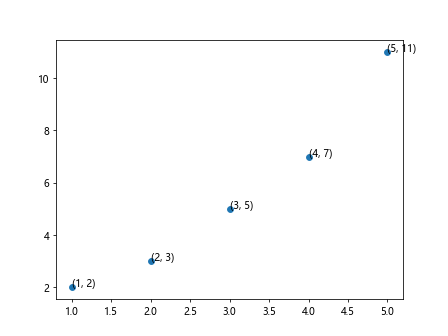
In this code snippet, we have labeled the data points with their corresponding x and y values.
Using Different Text Alignments
You can adjust the alignment of the labels to avoid overlapping with data points. Let’s see how to use different text alignments for labeling scatter points in Matplotlib.
import matplotlib.pyplot as plt

# Data
x = [1, 2, 3, 4, 5]
y = [2, 3, 5, 7, 11]
labels = ['A', 'B', 'C', 'D', 'E']

# Create a scatter plot
plt.scatter(x, y)

# Adjust text alignments
for i in range(len(x)):
    plt.annotate(labels[i], (x[i], y[i]), ha='right', va='bottom')

plt.show()
Output:
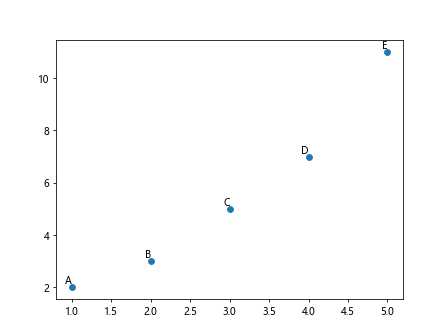
In this example, we have adjusted the horizontal alignment to right and vertical alignment to bottom for the labels.
Highlighting Specific Labels
You may want to highlight specific labels by changing their appearance. Let’s see how to highlight specific labels on a scatter plot in Matplotlib.
import matplotlib.pyplot as plt

# Data
x = [1, 2, 3, 4, 5]
y = [2, 3, 5, 7, 11]
labels = ['A', 'B', 'C', 'D', 'E']
highlight = ['B', 'D']

# Create a scatter plot
plt.scatter(x, y)

# Highlight specific labels
for i, txt in enumerate(labels):
    if txt in highlight:
        plt.annotate(txt, (x[i], y[i]), fontsize=12, color='red', fontweight='bold')
    else:
        plt.annotate(txt, (x[i], y[i]))

plt.show()
Output:
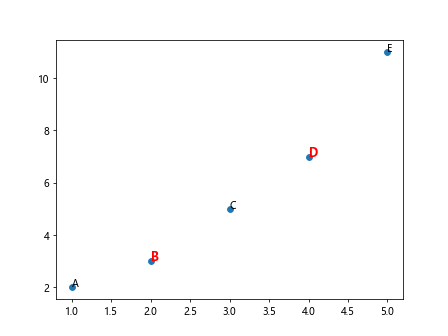
In this code snippet, we have highlighted specific labels by changing their font size, color to red, and weight to bold.
Adjusting Label Positions
You can fine-tune the positions of the labels to avoid overlapping and improve readability. Let’s see how to adjust label positions on a scatter plot in Matplotlib.
import matplotlib.pyplot as plt

# Data
x = [1, 2, 3, 4, 5]
y = [2, 3, 5, 7, 11]
labels = ['A', 'B', 'C', 'D', 'E']

# Create a scatter plot
plt.scatter(x, y)

# Adjust label positions
for i, txt in enumerate(labels):
    plt.annotate(txt, (x[i], y[i]), xytext=(x[i] + 0.1, y[i] + 0.1))

plt.show()
Output:
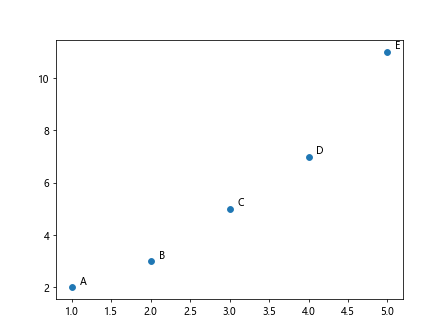
In this example, we have adjusted the label positions by adding a small offset to the x and y coordinates.
Using Background Color for Labels
You can add background color to the labels for better visibility and emphasis. Let’s see how to use background color for labels on a scatter plot in Matplotlib.
import matplotlib.pyplot as plt

# Data
x = [1, 2, 3, 4, 5]
y = [2, 3, 5, 7, 11]
labels = ['A', 'B', 'C', 'D', 'E']

# Create a scatter plot
plt.scatter(x, y)

# Add labels with background color
for i, txt in enumerate(labels):
    plt.annotate(txt, (x[i], y[i]), bbox=dict(facecolor='red', alpha=0.5))

plt.show()
Output:
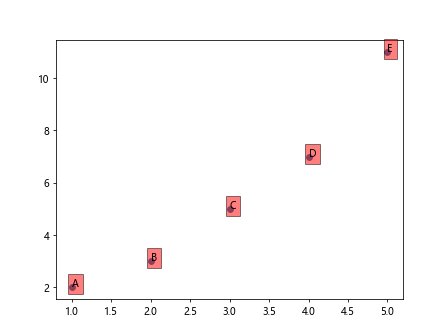
In this code snippet, we have added a red background color with 50% transparency to the labels for better visibility.
Adding Multiple Lines to Labels
Sometimes, you may need to add multiple lines of text to the labels for more detailed information. Let’s see how to add multiple lines to labels on a scatter plot in Matplotlib.
import matplotlib.pyplot as plt

# Data
x = [1, 2, 3, 4, 5]
y = [2, 3, 5, 7, 11]
labels = ['Line 1\nLine 2', 'A\nB', 'X', 'Hello\nWorld', 'How2\nMatplotlib']

# Create a scatter plot
plt.scatter(x, y)

# Add labels with multiple lines
for i, txt in enumerate(labels):
    plt.annotate(txt, (x[i], y[i]))

plt.show()
Output:
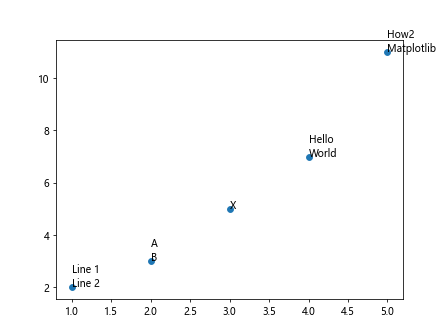
In this example, we have added multiple lines of text to the labels using the newline character \n.
Using Different Text Properties
You can apply different text properties, such as font size, weight, style, and color, to the labels for emphasis and clarity. Let’s see how to use different text properties for labeling scatter points in Matplotlib.
import matplotlib.pyplot as plt

# Data
x = [1, 2, 3, 4, 5]
y = [2, 3, 5, 7, 11]
labels = ['A', 'B', 'C', 'D', 'E']

# Create a scatter plot
plt.scatter(x, y)

# Customize text properties
for i, txt in enumerate(labels):
    plt.annotate(txt, (x[i], y[i]), fontsize=12, fontweight='bold', fontstyle='italic', color='blue')

plt.show()
Output:
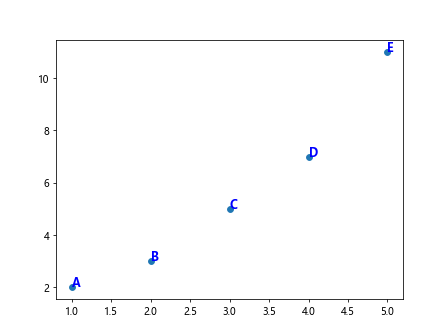
In this code snippet, we have applied different text properties, including font size, weight, style, and color, to the labels for better visibility.
Labeling Outliers
In some cases, you may want to label outliers or specific data points that deviate significantly from the rest. Let’s see how to label outliers on a scatter plot in Matplotlib.
import matplotlib.pyplot as plt

# Data
x = [1, 2, 3, 4, 5]
y = [2, 3, 5, 7, 20]
labels = ['A', 'B', 'C', 'D', 'E']

# Create a scatter plot
plt.scatter(x, y)

# Label outliers
outlier_threshold = 10
for i in range(len(x)):
    if y[i] > outlier_threshold:
        plt.annotate(labels[i], (x[i], y[i]))

plt.show()
Output:
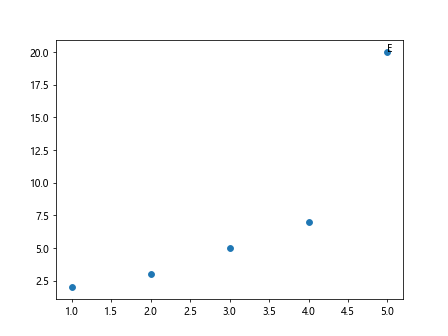
In this example, we have labeled outliers by setting a threshold value and comparing it with the y-coordinate of each data point.
Labeling Clusters
You can also label clustered data points to distinguish different groups or categories. Let’s see how to label clusters on a scatter plot in Matplotlib.
import matplotlib.pyplot as plt

# Data
x = [1, 2, 3, 4, 5, 6, 7, 8, 9, 10]
y = [2, 3, 5, 7, 11, 8, 9, 6, 4, 2]
labels = ['A', 'B', 'A', 'B', 'A', 'B', 'A', 'B', 'A', 'B']

# Create a scatter plot
plt.scatter(x, y)

# Label clusters
for i in range(len(x)):
    plt.annotate(labels[i], (x[i], y[i]))

plt.show()
Output:
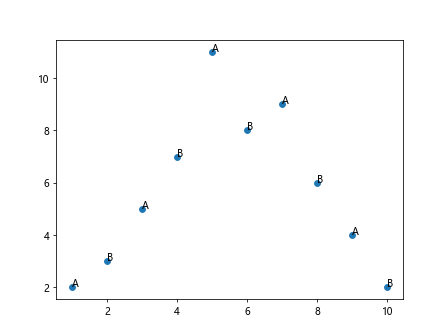
In this code snippet, we have labeled clustered data points with corresponding categories from the labels list.
Conclusion
In this article, we have explored various techniques for labeling scatter points in Matplotlib. By customizing labels, highlighting specific data points, adjusting label positions, and using different text properties, you can enhance the clarity and visual appeal of scatter plots. Experiment with these techniques and adapt them to your specific data visualization needs to create informative and engaging plots.