How to Add Error Bars in Matplotlib
Error bars are a useful tool in data visualization to indicate the uncertainty or variability of a data point. In this article, we will explore how to add error bars to plots using the matplotlib library in Python.
1. Basic Error Bars
You can add basic error bars to a plot using the errorbar function in matplotlib. Here is an example code snippet:
import matplotlib.pyplot as plt
import numpy as np

x = np.arange(1, 6)
y = np.array([1, 2, 3, 4, 5])
errors = np.array([0.5, 0.3, 0.2, 0.4, 0.6])

plt.errorbar(x, y, yerr=errors, fmt='o', color='blue')
plt.show()
Output:
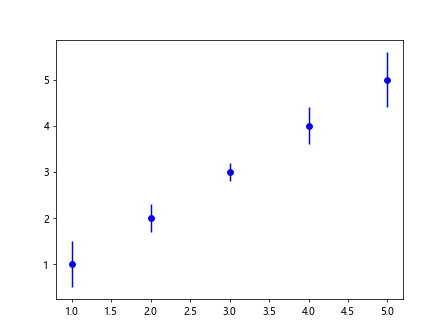
In this code snippet, x, y, and errors are arrays representing the x values, y values, and error values respectively. The errorbar function is used to plot the data points with error bars.
2. Customizing Error Bars
You can customize the appearance of error bars by specifying various parameters such as line style, color, error cap size, etc. Here is an example code snippet:
import matplotlib.pyplot as plt
import numpy as np

x = np.arange(1, 6)
y = np.array([1, 2, 3, 4, 5])
errors = np.array([0.5, 0.3, 0.2, 0.4, 0.6])

plt.errorbar(x, y, yerr=errors, fmt='o', color='green', linestyle='dashed', linewidth=2, capsize=5)
plt.show()
Output:
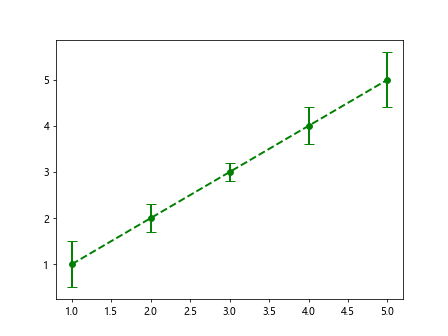
In this code snippet, we have customized the error bars by changing the color to green, using a dashed line style, increasing the line width, and setting the error cap size to 5.
3. Symmetric Error Bars
By default, error bars are symmetric in matplotlib. You can specify asymmetric error bars by providing a tuple of two arrays, where the first array represents the lower error values and the second array represents the upper error values. Here is an example code snippet:
import matplotlib.pyplot as plt
import numpy as np

x = np.arange(1, 6)
y = np.array([1, 2, 3, 4, 5])
errors = np.array([0.5, 0.3, 0.2, 0.4, 0.6])

lower_errors = np.array([0.2, 0.1, 0.3, 0.4, 0.2])
upper_errors = np.array([0.4, 0.3, 0.4, 0.6, 0.5])

plt.errorbar(x, y, yerr=[lower_errors, upper_errors], fmt='o', color='red')
plt.show()
Output:
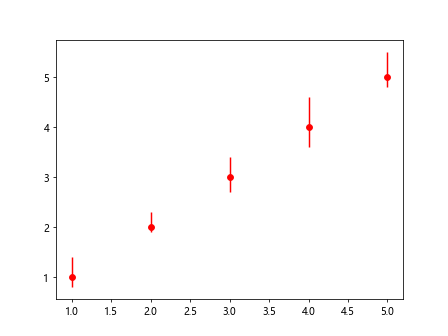
In this code snippet, we have specified asymmetric error bars using the yerr parameter with a tuple of lower and upper error arrays.
4. Bar Chart with Error Bars
You can add error bars to a bar chart using the bar function in matplotlib. Here is an example code snippet:
import matplotlib.pyplot as plt
import numpy as np

x = np.arange(1, 6)
y = np.array([1, 2, 3, 4, 5])
errors = np.array([0.5, 0.3, 0.2, 0.4, 0.6])

plt.bar(x, y, yerr=errors, color='skyblue')
plt.show()
Output:
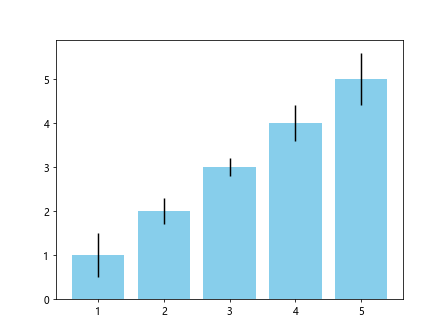
In this code snippet, we have created a bar chart with error bars using the bar function and specifying the error values with the yerr parameter.
5. Horizontal Error Bars
You can also add horizontal error bars to a plot by specifying the xerr parameter instead of yerr. Here is an example code snippet:
import matplotlib.pyplot as plt
import numpy as np

x = np.arange(1, 6)
y = np.array([1, 2, 3, 4, 5])
errors = np.array([0.5, 0.3, 0.2, 0.4, 0.6])

plt.errorbar(x, y, xerr=errors, fmt='o', color='purple')
plt.show()
Output:
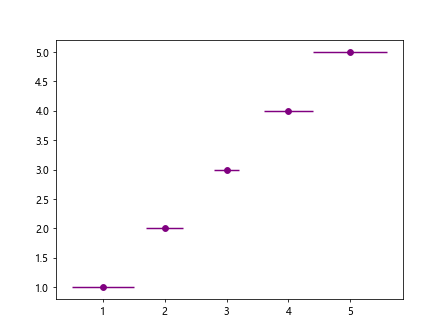
In this code snippet, we have added horizontal error bars to the plot by specifying the error values in the xerr parameter.
6. Error Bar Styles
Matplotlib provides different error bar styles that you can use to customize the appearance of error bars. Here are some common styles:
- ‘o’ : Circular markers
- ‘^’ : Triangle markers
- ‘-‘ : Solid line
- ‘–‘ : Dashed line
- ‘s’ : Square markers
You can combine these styles to create unique error bar plots. Here is an example code snippet:
import matplotlib.pyplot as plt
import numpy as np

x = np.arange(1, 6)
y = np.array([1, 2, 3, 4, 5])
errors = np.array([0.5, 0.3, 0.2, 0.4, 0.6])

plt.errorbar(x, y, yerr=errors, fmt='s--', color='orange', capsize=3)
plt.show()
Output:
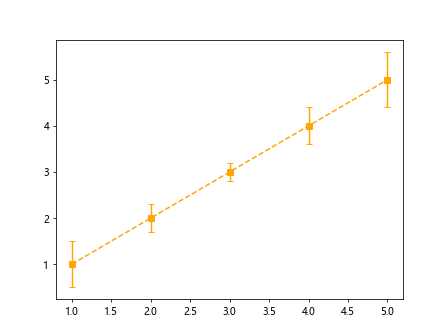
In this code snippet, we have combined square markers, dashed line style, and specified an orange color for the error bars.
7. Multiple Error Bars
You can add multiple sets of error bars to a plot by calling the errorbar function multiple times. Here is an example code snippet:
import matplotlib.pyplot as plt
import numpy as np

x = np.arange(1, 6)
y = np.array([1, 2, 3, 4, 5])
errors = np.array([0.5, 0.3, 0.2, 0.4, 0.6])

errors1 = np.array([0.5, 0.3, 0.2, 0.4, 0.6])
errors2 = np.array([0.3, 0.2, 0.4, 0.5, 0.7])

plt.errorbar(x, y, yerr=errors1, fmt='o', color='blue', label='Set 1')
plt.errorbar(x, y+1, yerr=errors2, fmt='^', color='green', label='Set 2')
plt.legend()
plt.show()
Output:
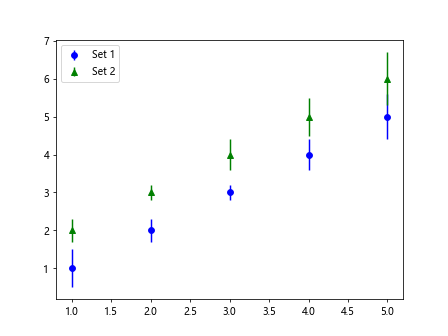
In this code snippet, we have added two sets of error bars to the plot by calling the errorbar function twice with different error values.
8. Line Plot with Error Bars
You can also add error bars to a line plot using the plot function in matplotlib. Here is an example code snippet:
import matplotlib.pyplot as plt
import numpy as np

x = np.arange(1, 6)
y = np.array([1, 2, 3, 4, 5])
errors = np.array([0.5, 0.3, 0.2, 0.4, 0.6])

plt.errorbar(x, y, yerr=errors, fmt='s--', color='purple')
plt.plot(x, y, color='purple', linestyle='dotted')
plt.show()
Output:
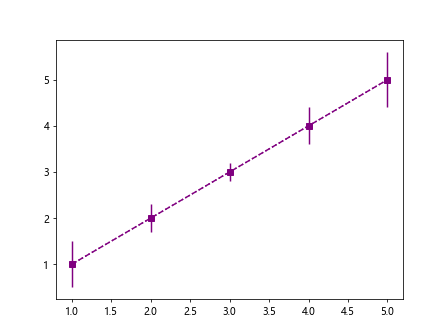
In this code snippet, we have added error bars to a line plot by first calling errorbar to plot the error bars and then calling plot to plot the line connecting the data points.
9. Custom Error Bar Caps
You can customize the appearance of error bar caps by specifying the capstyle parameter. Here is an example code snippet:
import matplotlib.pyplot as plt
import numpy as np

x = np.arange(1, 6)
y = np.array([1, 2, 3, 4, 5])
errors = np.array([0.5, 0.3, 0.2, 0.4, 0.6])

plt.errorbar(x, y, yerr=errors, fmt='o', color='red', capsize=8, capthick=2, capstyle='round')
plt.show()
In this code snippet, we have customized the error bar caps by increasing the cap size, thickness, and setting the cap style to round.
10. Log Scale Error Bars
You can add error bars to a plot with a logarithmic scale by setting the scale of the plot to logarithmic. Here is an example code snippet:
import matplotlib.pyplot as plt
import numpy as np

x = np.arange(1, 6)
y = np.array([1, 2, 3, 4, 5])
errors = np.array([0.5, 0.3, 0.2, 0.4, 0.6])

plt.errorbar(x, y, yerr=errors, fmt='o', color='blue')
plt.yscale('log')
plt.show()
Output:
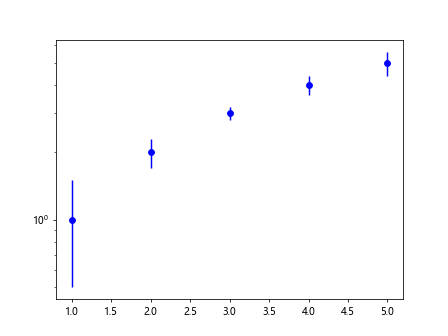
In this code snippet, we have added error bars to a plot with a logarithmic scale on the y-axis using the yscale function.
Conclusion
In this article, we have explored how to add error bars to plots in matplotlib. We have covered basic error bars, customizing error bars, symmetric and asymmetric error bars, bar charts with error bars, horizontal error bars, error bar styles, multiple error bars, line plots with error bars, custom error bar caps, and logarithmic scale error bars. Error bars are a valuable tool in data visualization to represent uncertainty or variability in the data.