How to Label Each Point in Scatter Plot using Matplotlib
Scatter plots are a great way to visualize the relationship between two variables. However, sometimes it is necessary to label each point in the scatter plot to provide additional information. In this tutorial, we will learn how to label each point in a scatter plot using Matplotlib.
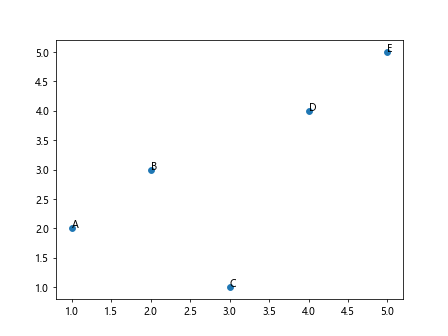
1. Basic Scatter Plot with Labels
import matplotlib.pyplot as plt

x = [1, 2, 3, 4, 5]
y = [2, 3, 1, 4, 5]
labels = ['A', 'B', 'C', 'D', 'E']

plt.scatter(x, y)
for i, label in enumerate(labels):
    plt.annotate(label, (x[i], y[i]))

plt.show()
Output:
2. Customizing Label Positions
import matplotlib.pyplot as plt

x = [1, 2, 3, 4, 5]
y = [2, 3, 1, 4, 5]
labels = ['A', 'B', 'C', 'D', 'E']

plt.scatter(x, y)
for i, label in enumerate(labels):
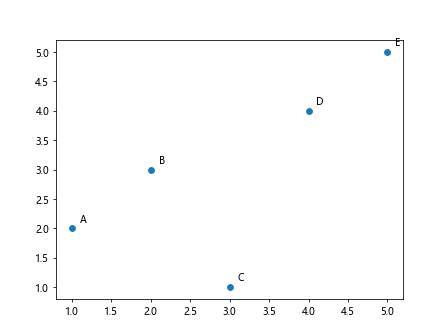
    plt.annotate(label, (x[i] + 0.1, y[i] + 0.1))

plt.show()
Output:
3. Colored Labels
import matplotlib.pyplot as plt

x = [1, 2, 3, 4, 5]
y = [2, 3, 1, 4, 5]
labels = ['A', 'B', 'C', 'D', 'E']

plt.scatter(x, y)
for i, label in enumerate(labels):
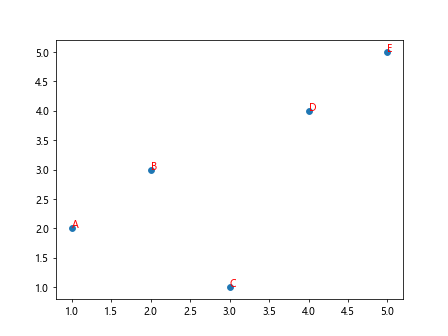
    plt.annotate(label, (x[i], y[i]), color='red')

plt.show()
Output:
4. Adding Arrows to Labels
import matplotlib.pyplot as plt

x = [1, 2, 3, 4, 5]
y = [2, 3, 1, 4, 5]
labels = ['A', 'B', 'C', 'D', 'E']

plt.scatter(x, y)
for i, label in enumerate(labels):
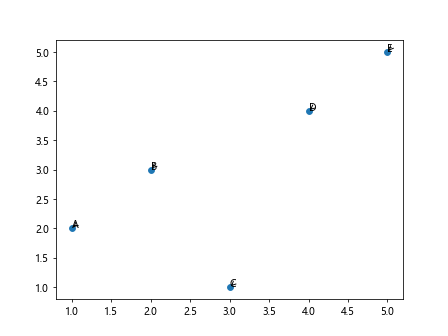
    plt.annotate(label, (x[i], y[i]), arrowprops=dict(arrowstyle='->'))

plt.show()
Output:
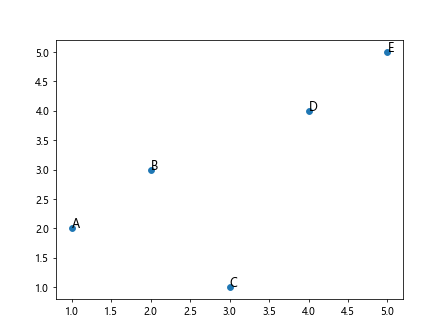
5. Customizing Font Size and Style
import matplotlib.pyplot as plt

x = [1, 2, 3, 4, 5]
y = [2, 3, 1, 4, 5]
labels = ['A', 'B', 'C', 'D', 'E']

plt.scatter(x, y)
for i, label in enumerate(labels):
    plt.annotate(label, (x[i], y[i]), fontsize=12, fontstyle='italic')

plt.show()
Output:
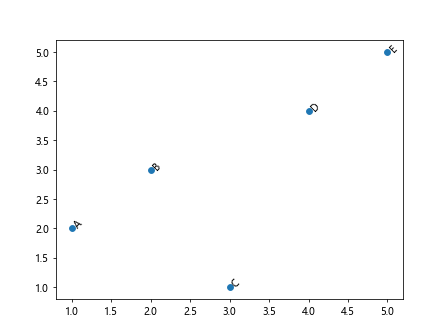
6. Rotating Labels
import matplotlib.pyplot as plt

x = [1, 2, 3, 4, 5]
y = [2, 3, 1, 4, 5]
labels = ['A', 'B', 'C', 'D', 'E']

plt.scatter(x, y)
for i, label in enumerate(labels):
    plt.annotate(label, (x[i], y[i]), rotation=45)

plt.show()
Output:
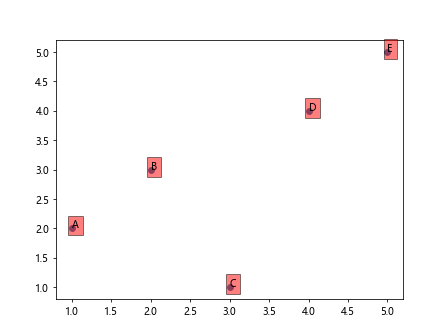
7. Adding Background Color to Labels
import matplotlib.pyplot as plt

x = [1, 2, 3, 4, 5]
y = [2, 3, 1, 4, 5]
labels = ['A', 'B', 'C', 'D', 'E']

plt.scatter(x, y)
for i, label in enumerate(labels):
    plt.annotate(label, (x[i], y[i]), bbox=dict(facecolor='red', alpha=0.5))

plt.show()
Output:
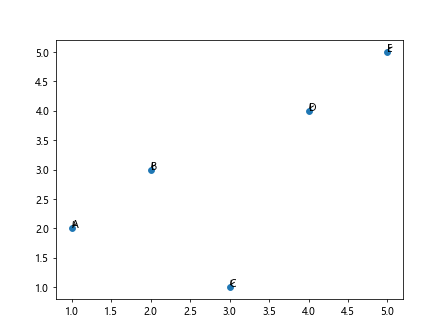
8. Customizing Arrow Properties
import matplotlib.pyplot as plt

x = [1, 2, 3, 4, 5]
y = [2, 3, 1, 4, 5]
labels = ['A', 'B', 'C', 'D', 'E']

plt.scatter(x, y)
for i, label in enumerate(labels):
    plt.annotate(label, (x[i], y[i]), arrowprops=dict(arrowstyle='->', connectionstyle='arc3, rad=0.5'))

plt.show()
Output:
9. Using a Custom Font
import matplotlib.pyplot as plt

x = [1, 2, 3, 4, 5]
y = [2, 3, 1, 4, 5]
labels = ['A', 'B', 'C', 'D', 'E']

plt.scatter(x, y)
for i, label in enumerate(labels):
    plt.annotate(label, (x[i], y[i]), fontname='Comic Sans MS')

plt.show()
Output:
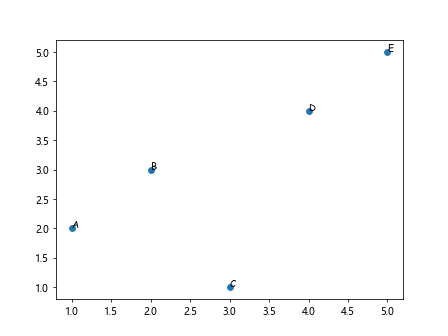
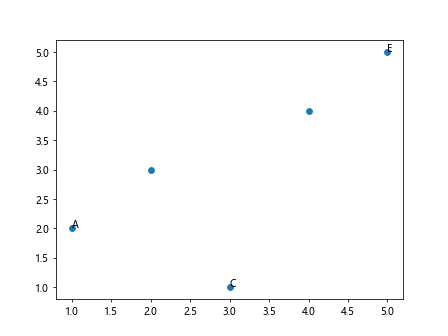
10. Labeling a Subset of Points
import matplotlib.pyplot as plt

x = [1, 2, 3, 4, 5]
y = [2, 3, 1, 4, 5]
labels = ['A', '', 'C', '', 'E']

plt.scatter(x, y)
for i, label in enumerate(labels):
    if label:
        plt.annotate(label, (x[i], y[i]))

plt.show()
Output:
Conclusion
In this tutorial, we learned how to label each point in a scatter plot using Matplotlib. We covered various customization options such as changing label positions, colors, adding arrows, customizing font size and style, rotating labels, adding background colors, customizing arrow properties, using custom fonts, and labeling a subset of points. By using these techniques, you can effectively communicate additional information in your scatter plots.