How to Label Points in Matplotlib
Matplotlib is a powerful plotting library in Python that allows you to create various types of plots with ease. When visualizing data, it is often helpful to label specific data points to provide additional information or context. In this article, we will explore how to label points in Matplotlib using different methods and techniques.
Method 1: Annotate Function
The annotate function in Matplotlib is a versatile tool that can be used to add text annotations to a plot. You can specify the position of the text, as well as customize the appearance of the text, such as font size, color, and alignment.
import matplotlib.pyplot as plt

x = [1, 2, 3, 4, 5]
y = [2, 3, 5, 7, 11]

plt.scatter(x, y)

plt.annotate('Prime number', (5, 11), xytext=(6, 12),
             arrowprops=dict(facecolor='black', shrink=0.05))

plt.show()
Output:
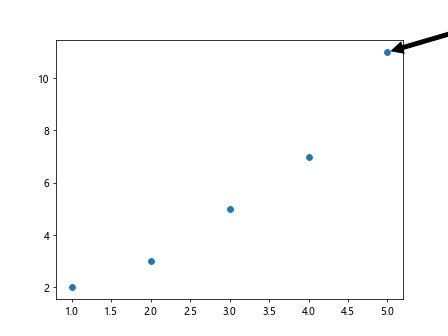
In this example, we are using the annotate function to label a specific data point (5, 11) on the scatter plot.
Method 2: Text Function
Another way to label points in Matplotlib is to use the text function. This function allows you to add text at any position on the plot, not necessarily associated with data points.
import matplotlib.pyplot as plt

plt.text(0.5, 0.5, 'how2matplotlib.com', fontsize=12, color='red')

plt.show()
Output:
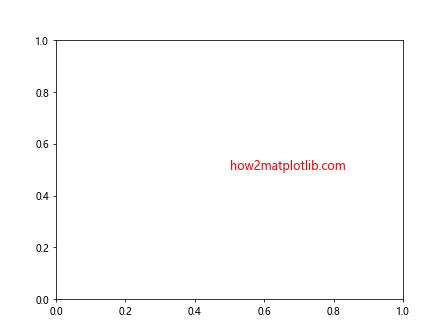
In this example, we are adding the text “how2matplotlib.com” at the position (0.5, 0.5) on the plot.
Method 3: Labeling Specific Data Points
Sometimes, you may want to label specific data points on a plot. You can achieve this by iterating through the data points and adding text annotations using the annotate function.
import matplotlib.pyplot as plt

x = [1, 2, 3, 4, 5]
y = [2, 3, 5, 7, 11]
labels = ['A', 'B', 'C', 'D', 'E']

plt.scatter(x, y)

for i, label in enumerate(labels):
    plt.annotate(label, (x[i], y[i]), textcoords="offset points", xytext=(0,10), ha='center')

plt.show()
Output:
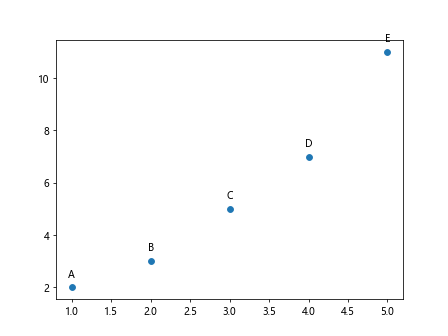
In this example, we are labeling each data point with the corresponding label from the labels list.
Method 4: Using Arrowprops
You can also customize the appearance of the annotations by using the arrowprops argument in the annotate function. This allows you to add arrows pointing to the labeled points.
import matplotlib.pyplot as plt

x = [1, 2, 3, 4, 5]
y = [2, 3, 5, 7, 11]
labels = ['A', 'B', 'C', 'D', 'E']

plt.scatter(x, y)

for i, label in enumerate(labels):
    plt.annotate(label, (x[i], y[i]), xytext=(x[i]+0.5, y[i]+1),
                 arrowprops=dict(facecolor='black', arrowstyle='->'))

plt.show()
Output:
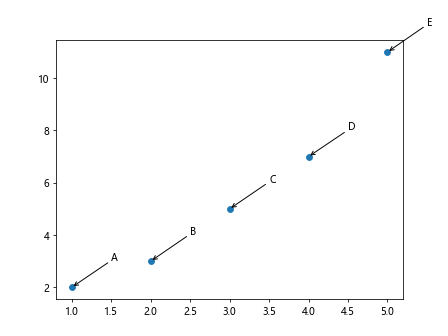
In this example, we are adding arrows pointing to each labeled point on the scatter plot.
Method 5: Highlighting Specific Points
If you want to highlight specific data points with labels, you can change the appearance of the labeled points by adjusting the font size, color, and style.
import matplotlib.pyplot as plt

x = [1, 2, 3, 4, 5]
y = [2, 3, 5, 7, 11]
labels = ['A', 'B', 'C', 'D', 'E']

plt.scatter(x, y)

for i, label in enumerate(labels):
    if label == 'C':
        plt.annotate(label, (x[i], y[i]), fontsize=12, color='red', fontweight='bold')
    else:
        plt.annotate(label, (x[i], y[i]), fontsize=10, color='black', fontweight='normal')

plt.show()
Output:
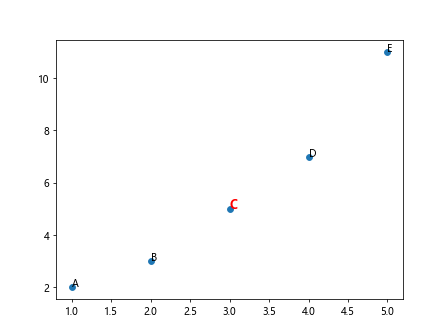
In this example, we are changing the appearance of the label for the data point ‘C’ to be larger, red, and bold.
Method 6: Adding Background Color
You can enhance the visibility of the labels by adding a background color to the annotations. This can help differentiate the labels from the plot background.
import matplotlib.pyplot as plt

x = [1, 2, 3, 4, 5]
y = [2, 3, 5, 7, 11]
labels = ['A', 'B', 'C', 'D', 'E']

plt.scatter(x, y)

for i, label in enumerate(labels):
    plt.annotate(label, (x[i], y[i]), fontsize=10, color='black', bbox=dict(facecolor='white', edgecolor='black'))

plt.show()
Output:
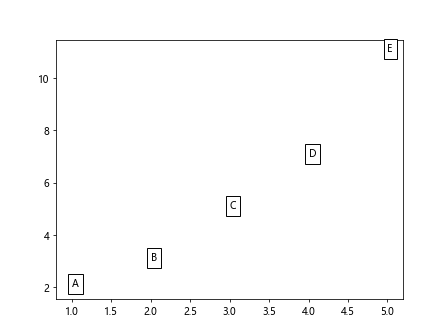
In this example, we are adding a white background with a black border to each label on the scatter plot.
Method 7: Rotating Text
By default, text annotations are horizontally aligned. You can rotate the text to any angle using the rotation parameter in the annotate function.
import matplotlib.pyplot as plt

x = [1, 2, 3, 4, 5]
y = [2, 3, 5, 7, 11]
labels = ['A', 'B', 'C', 'D', 'E']

plt.scatter(x, y)

for i, label in enumerate(labels):
    plt.annotate(label, (x[i], y[i]), textcoords="offset points", xytext=(0,10), ha='center', rotation=45)

plt.show()
Output:
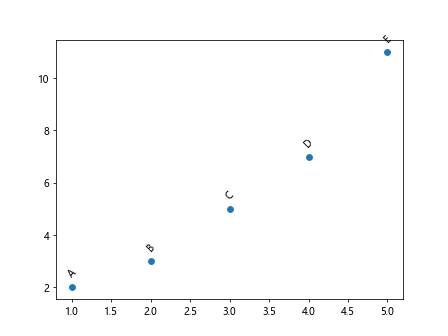
In this example, we are rotating the text labels by 45 degrees on the scatter plot.
Method 8: Customizing Arrow Properties
You can further customize the appearance of the arrows in the annotations by adjusting the arrow properties such as width, color, and style.
import matplotlib.pyplot as plt

x = [1, 2, 3, 4, 5]
y = [2, 3, 5, 7, 11]
labels = ['A', 'B', 'C', 'D', 'E']

plt.scatter(x, y)

for i, label in enumerate(labels):
    plt.annotate(label, (x[i], y[i]), xytext=(x[i]+0.5, y[i]+1),
                 arrowprops=dict(arrowstyle='->', lw=2, color='blue'))

plt.show()
Output:
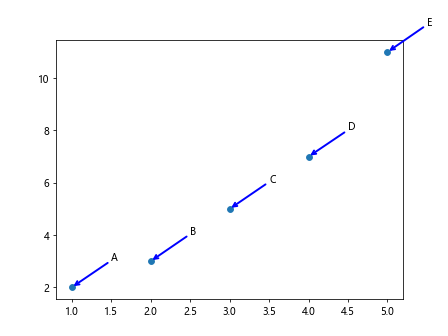
In this example, we are customizing the appearance of the arrows in the annotations with a thicker blue line.
Method 9: Adding Annotations with Box
You can add annotations with a box around the text by using the FancyBboxPatch class from the matplotlib.patches module.
import matplotlib.pyplot as plt
from matplotlib.patches import FancyBboxPatch

x = [1, 2, 3, 4, 5]
y = [2, 3, 5, 7, 11]
labels = ['A', 'B', 'C', 'D', 'E']

fig, ax = plt.subplots()
ax.scatter(x, y)

for i, label in enumerate(labels):
    bbox_props = dict(boxstyle="round,pad=0.3", fc="cyan", ec="b", lw=2)
    ax.annotate(label, (x[i], y[i]), xytext=(x[i]+0.5, y[i]+1), bbox=bbox_props)

plt.show()
Output:
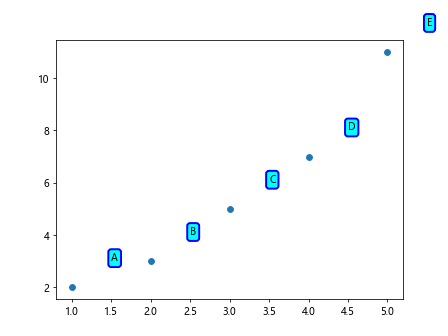
In this example, we are adding annotations with a rounded box around the text on the scatter plot.
Method 10: Adding Annotations with Arrow and Box
You can combine arrow and box annotations to highlight specific data points on the plot effectively.
import matplotlib.pyplot as plt
from matplotlib.patches import FancyBboxPatch

x = [1, 2, 3, 4, 5]
y = [2, 3, 5, 7, 11]
labels = ['A', 'B', 'C', 'D', 'E']

fig, ax = plt.subplots()
ax.scatter(x, y)

for i, label in enumerate(labels):
    bbox_props = dict(boxstyle="round,pad=0.3", fc="cyan", ec="b", lw=2)
    ax.annotate(label, (x[i], y[i]), xytext=(x[i]+0.5, y[i]+1),
                arrowprops=dict(facecolor='black', shrink=0.05), bbox=bbox_props)

plt.show()
Output:
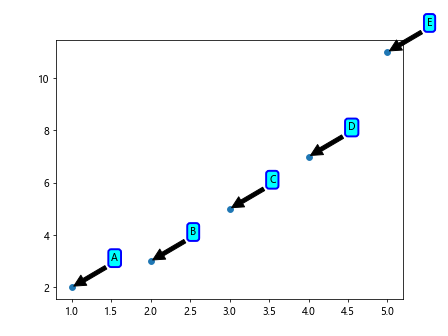
In this example, we are combining arrow annotations with rounded box annotations for specific data points on the scatter plot.
Conclusion
Labeling points in Matplotlib is an essential aspect of data visualization, as it helps convey additional information and insights to the viewer. In this article, we have explored various methods and techniques for adding labels to points on plots, including using the annotate and text functions, customizing appearance with arrows and boxes, and highlighting specific data points. By applying these techniques in your plots, you can effectively communicate important information and enhance the overall clarity of your visualizations. Experiment with different labeling methods to find the most suitable approach for your data and analytical needs.