Figure Title in Matplotlib
When creating plots using Matplotlib in Python, it is important to add appropriate titles to your figures. A well-chosen title can provide context and clarity to your visualization, helping viewers to understand the data being presented. In this article, we will explore different ways to add figure titles in Matplotlib.
Adding a Simple Title
The simplest way to add a title to a Matplotlib figure is by using the title() function. Here is an example:
import matplotlib.pyplot as plt

x = [1, 2, 3, 4, 5]
y = [2, 3, 5, 7, 11]

plt.plot(x, y)
plt.title('Example Figure Title')
plt.show()
Output:
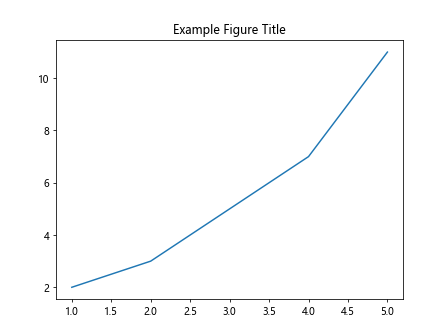
In this code snippet, we use the title() function to add the title “Example Figure Title” to our plot. When you run this code, the plot will display with the given title.
Customizing Figure Titles
Matplotlib allows you to customize the appearance of figure titles by specifying font size, font weight, color, and other properties. Here is an example that demonstrates how to customize a figure title:
import matplotlib.pyplot as plt

x = [1, 2, 3, 4, 5]
y = [2, 3, 5, 7, 11]

plt.plot(x, y)
plt.title('Customized Figure Title', fontsize=16, fontweight='bold', color='blue')
plt.show()
Output:
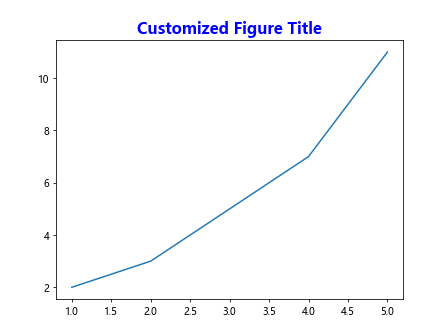
In this code snippet, we use additional arguments in the title() function to specify the font size, weight, and color of the title. You can experiment with different values for these arguments to achieve the desired look for your figure title.
Multiple Titles in Subplots
If you are creating subplots in Matplotlib, you may want to add separate titles to each subplot. Here is an example that demonstrates how to add multiple titles to subplots:
import matplotlib.pyplot as plt

x = [1, 2, 3, 4, 5]
y1 = [2, 3, 5, 7, 11]
y2 = [1, 4, 9, 16, 25]

plt.subplot(1, 2, 1)
plt.plot(x, y1)
plt.title('First Subplot Title')

plt.subplot(1, 2, 2)
plt.plot(x, y2)
plt.title('Second Subplot Title')

plt.show()
Output:
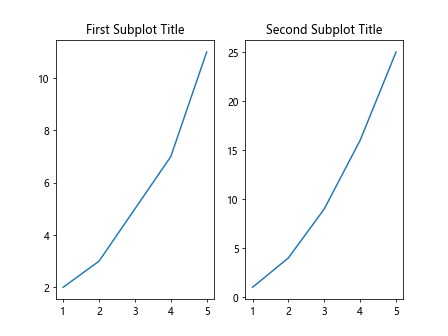
In this code snippet, we create two subplots and add separate titles to each subplot using the title() function. When you run this code, you will see two subplots with the specified titles.
Rotated Title
You can rotate a figure title in Matplotlib by using the rotation argument in the title() function. Here is an example demonstrating how to add a rotated title to a plot:
import matplotlib.pyplot as plt

x = [1, 2, 3, 4, 5]
y = [2, 3, 5, 7, 11]

plt.plot(x, y)
plt.title('Rotated Figure Title', rotation=45)
plt.show()
Output:
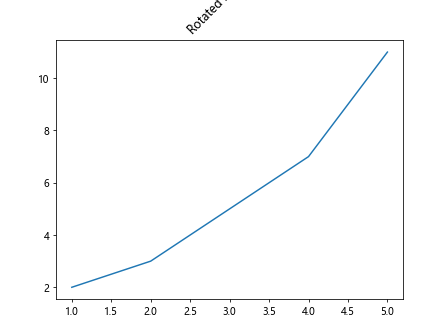
In this code snippet, we set the rotation argument to 45 degrees, which rotates the title text by 45 degrees. You can adjust the rotation angle to achieve the desired orientation for your figure title.
Multi-line Title
If you need to display a multi-line title in Matplotlib, you can use a line break character \n to separate the lines. Here is an example demonstrating how to create a multi-line title:
import matplotlib.pyplot as plt

x = [1, 2, 3, 4, 5]
y = [2, 3, 5, 7, 11]

plt.plot(x, y)
plt.title('Multi-line\nFigure Title')
plt.show()
Output:
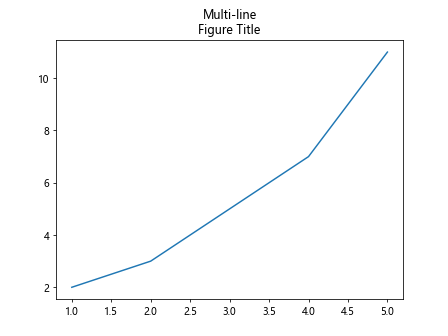
In this code snippet, we use the \n character to create a line break in the title text, resulting in a multi-line title when the plot is displayed.
Aligning Title
You can specify the alignment of a figure title in Matplotlib using the loc argument in the title() function. Here is an example demonstrating how to align a title to the right:
import matplotlib.pyplot as plt

x = [1, 2, 3, 4, 5]
y = [2, 3, 5, 7, 11]

plt.plot(x, y)
plt.title('Right Aligned Title', loc='right')
plt.show()
Output:
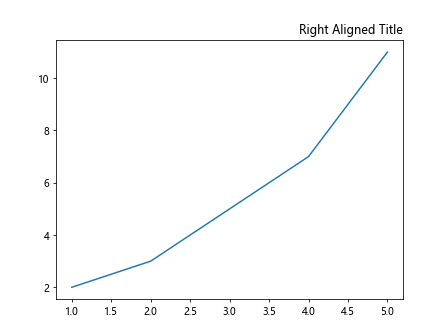
In this code snippet, we set the loc argument to ‘right’, aligning the title to the right side of the plot. You can also use ‘left’ or ‘center’ to align the title accordingly.
Adding Text Alongside Title
You can add additional text alongside a figure title in Matplotlib by using the text() function. Here is an example demonstrating how to add text alongside the title:
import matplotlib.pyplot as plt

x = [1, 2, 3, 4, 5]
y = [2, 3, 5, 7, 11]

plt.plot(x, y)
plt.title('Figure Title')
plt.text(3, 10, 'Additional Text', fontsize=12, color='red')
plt.show()
Output:
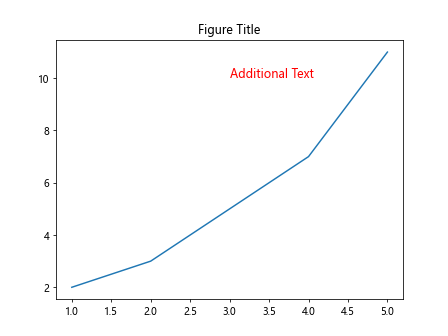
In this code snippet, we use the text() function to add the text ‘Additional Text’ alongside the figure title. You can adjust the position, font size, and color of the text as needed.
Adding Title to 3D Plot
When creating 3D plots in Matplotlib, you can add titles to the figure, as well as to the individual axes. Here is an example demonstrating how to add a title to a 3D plot:
import numpy as np
import matplotlib.pyplot as plt
from mpl_toolkits.mplot3d import Axes3D

x = np.linspace(-5, 5, 100)
y = np.linspace(-5, 5, 100)
X, Y = np.meshgrid(x, y)
Z = np.sin(np.sqrt(X**2 + Y**2))

fig = plt.figure()
ax = fig.add_subplot(111, projection='3d')
ax.plot_surface(X, Y, Z)
ax.set_title('3D Plot Title')

plt.show()
Output:
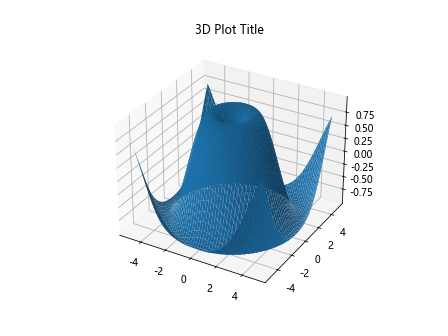
In this code snippet, we create a 3D surface plot and add a title to the figure using the set_title() function on the axes object. You can also add titles to the individual axes in a 3D plot for additional clarity.
Overlapping Title
In some cases, you may want to overlap the title on top of the plot area for a specific effect. Here is an example demonstrating how to overlap a title on a plot:
import matplotlib.pyplot as plt

x = [1, 2, 3, 4, 5]
y = [2, 3, 5, 7, 11]

plt.plot(x, y)
plt.title('Overlapping Title', y=1.05)
plt.show()
Output:
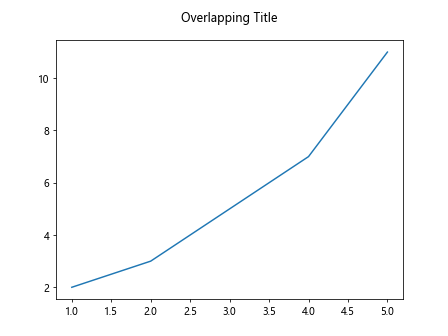
In this code snippet, we set the y argument to 1.05 in the title() function, which positions the title slightly outside the plot area, creating an overlapping effect. You can adjust the position as needed for different visual effects.
Title with Math Symbols
If you need to display mathematical symbols in a figure title in Matplotlib, you can use LaTeX formatting. Here is an example demonstrating how to include math symbols in a figure title:
import matplotlib.pyplot as plt

x = [1, 2, 3, 4, 5]
y = [2, 3, 5, 7, 11]

plt.plot(x, y)
plt.title('Figure Title with $\\alpha$ Symbol')
plt.show()
Output:
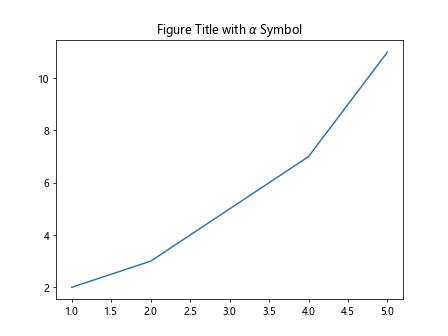
In this code snippet, we use LaTeX formatting to include the math symbol $\alpha$ in the figure title. You can use a similar approach to display other mathematical symbols as needed.
Figure Title in Matplotlib Conclusion
In this article, we have explored various techniques for adding and customizing figure titles in Matplotlib. From simple titles to multi-line, rotated, aligned, and overlapped titles, there are numerous ways to enhance the visual appeal and clarity of your plots. By experimenting with different title styles and customization options, you can create more engaging and informative visualizations in Matplotlib.