Figure Set Title
In Matplotlib, figures are the top level container for all the plot elements. The title of a figure provides a concise and informative description of the plot. This article will explore how to set the title of a figure in Matplotlib.
Setting Figure Title
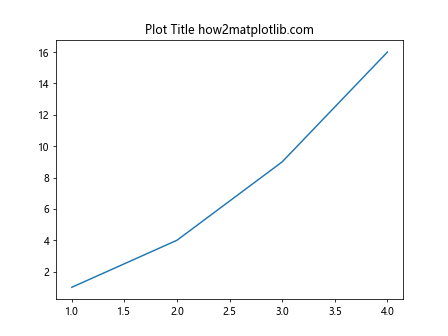
You can set the title of a figure using the set_title() method. Here is an example:
import matplotlib.pyplot as plt

plt.figure()
plt.plot([1, 2, 3, 4], [1, 4, 9, 16])
plt.title('Plot Title how2matplotlib.com')
plt.show()
Output:
Modifying Title Properties
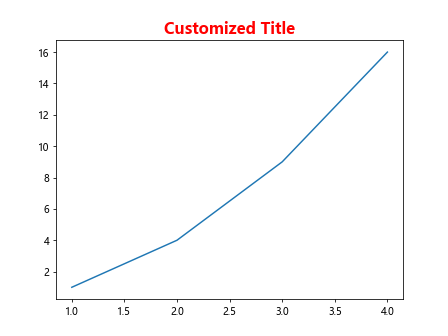
You can customize the title font size, color, and other properties using the set_title() method along with additional parameters. Here is an example:
import matplotlib.pyplot as plt

plt.figure()
plt.plot([1, 2, 3, 4], [1, 4, 9, 16])
plt.title('Customized Title', fontsize=16, color='red', fontweight='bold')
plt.show()
Output:
Adding a Subtitle
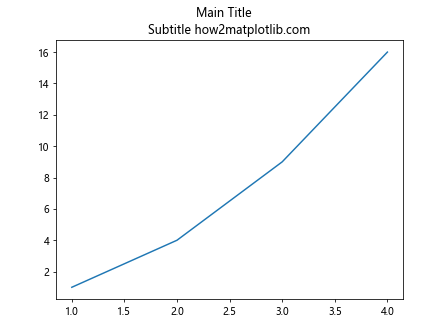
If you want to add a subtitle to your figure, you can use the suptitle() method. Here is an example:
import matplotlib.pyplot as plt

plt.figure()
plt.plot([1, 2, 3, 4], [1, 4, 9, 16])
plt.suptitle('Main Title')
plt.title('Subtitle how2matplotlib.com')
plt.show()
Output:
Centering Title
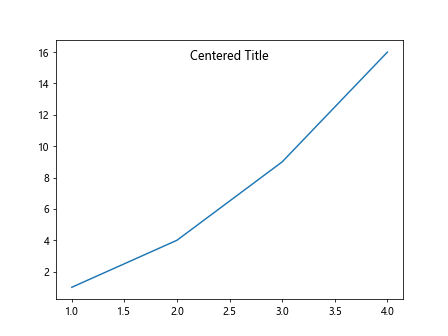
By default, the title is centered above the plot. You can adjust the positioning of the title by specifying the x and y parameters. Here is an example:
import matplotlib.pyplot as plt

plt.figure()
plt.plot([1, 2, 3, 4], [1, 4, 9, 16])
plt.title('Centered Title', x=0.5, y=0.9, loc='center')
plt.show()
Output:
Multi-line Title
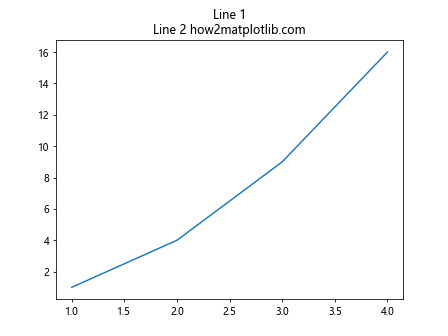
If you want to create a multi-line title, you can use the line break character \n in the title string. Here is an example:
import matplotlib.pyplot as plt

plt.figure()
plt.plot([1, 2, 3, 4], [1, 4, 9, 16])
plt.title('Line 1\nLine 2 how2matplotlib.com')
plt.show()
Output:
Title with Math Text
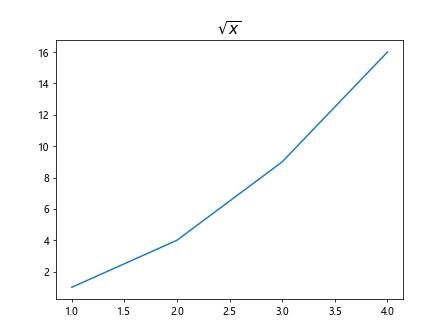
You can include mathematical expressions in the title using LaTeX syntax within dollar signs $. Here is an example:
import matplotlib.pyplot as plt

plt.figure()
plt.plot([1, 2, 3, 4], [1, 4, 9, 16])
plt.title(r'$\sqrt{x}$', fontsize=16)
plt.show()
Output:
Rotating Title
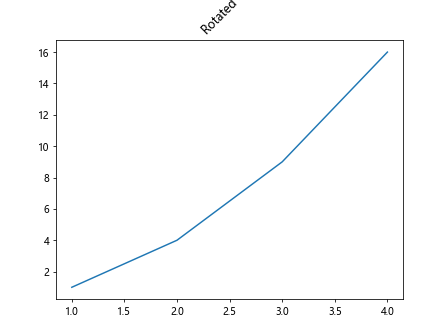
If you want to rotate the title of the figure, you can specify the rotation parameter. Here is an example:
import matplotlib.pyplot as plt

plt.figure()
plt.plot([1, 2, 3, 4], [1, 4, 9, 16])
plt.title('Rotated Title', rotation=45)
plt.show()
Output:
Title Alignment
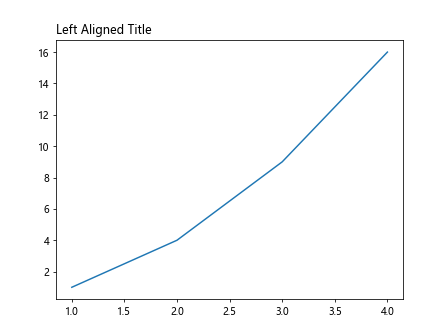
You can align the title to the left, right, or center using the loc parameter. Here is an example:
import matplotlib.pyplot as plt

plt.figure()
plt.plot([1, 2, 3, 4], [1, 4, 9, 16])
plt.title('Left Aligned Title', loc='left')
plt.show()
Output:
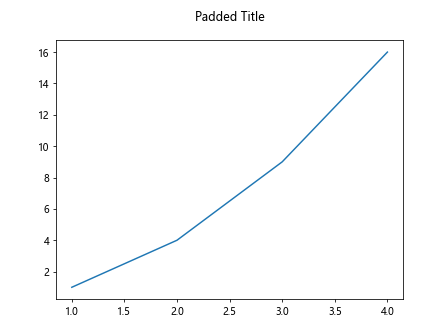
Title Padding
You can adjust the distance between the title and the top of the figure using the pad parameter. Here is an example:
import matplotlib.pyplot as plt

plt.figure()
plt.plot([1, 2, 3, 4], [1, 4, 9, 16])
plt.title('Padded Title', pad=20)
plt.show()
Output:
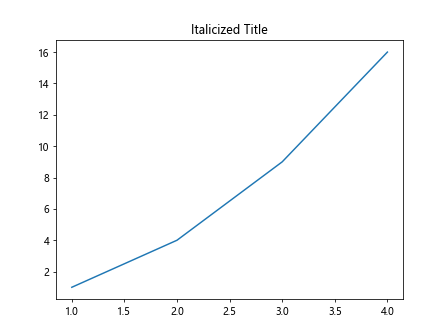
Title Font Style
You can specify the font style of the title using the fontstyle parameter. Here is an example:
import matplotlib.pyplot as plt

plt.figure()
plt.plot([1, 2, 3, 4], [1, 4, 9, 16])
plt.title('Italicized Title', fontstyle='italic')
plt.show()
Output:
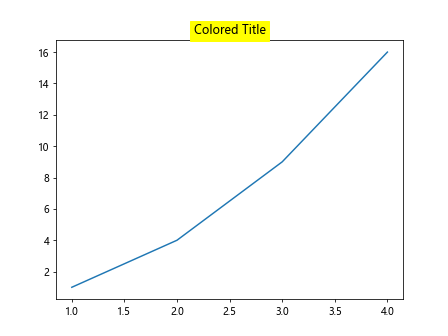
Title Background Color
You can change the background color of the title using the bbox parameter. Here is an example:
import matplotlib.pyplot as plt

plt.figure()
plt.plot([1, 2, 3, 4], [1, 4, 9, 16])
plt.title('Colored Title', backgroundcolor='yellow')
plt.show()
Output:
Multiple Figures with Titles
If you are creating multiple figures, you can set titles for each figure individually. Here is an example:
import matplotlib.pyplot as plt

fig1 = plt.figure()
plt.plot([1, 2, 3, 4], [1, 4, 9, 16])
plt.title('Figure 1 Title')

fig2 = plt.figure()
plt.plot([1, 2, 3, 4], [1, 8, 27, 64])
plt.title('Figure 2 Title')

plt.show()
Output:
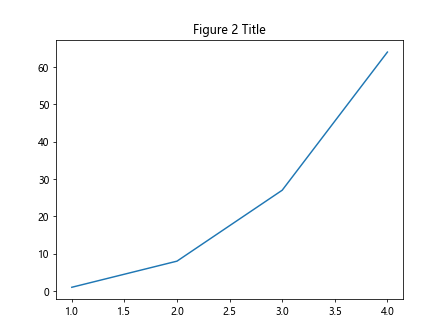
Figure Set Title Conclusion
Setting the title of a figure in Matplotlib allows you to provide context and information about the plot. By customizing the title properties, alignment, and style, you can make your plots more informative and visually appealing. Experiment with the examples provided in this article to create compelling figure titles in your Matplotlib plots.