Adding Title to Figure in Matplotlib: fig.suptitle
When creating visualizations using Matplotlib, it is often necessary to add a title to the entire figure rather than just to a specific plot. This can be achieved using the fig.suptitle() method. In this article, we will explore how to add a suptitle to a figure in Matplotlib with detailed examples.
Basic Usage
To add a suptitle to a figure in Matplotlib, you can use the fig.suptitle() method. This method takes the title string as an argument and allows you to customize the font properties of the title. Here is a basic example:
import matplotlib.pyplot as plt

fig, ax = plt.subplots()
ax.plot([1, 2, 3, 4], [1, 4, 2, 3])

fig.suptitle('Main Title')
plt.show()
Output:
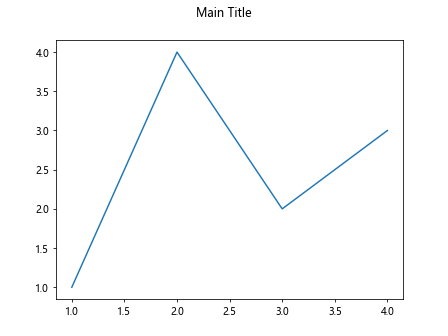
In this example, we create a simple line plot and then add a suptitle “Main Title” to the figure.
Customizing the Suptitle
You can customize the suptitle by providing additional parameters to the fig.suptitle() method. For example, you can change the font size, font weight, font style, and color of the suptitle. Here is an example:
import matplotlib.pyplot as plt

fig, ax = plt.subplots()
ax.plot([1, 2, 3, 4], [1, 4, 2, 3])

fig.suptitle('Customized Title', fontsize=16, fontweight='bold', fontstyle='italic', color='blue')
plt.show()
Output:
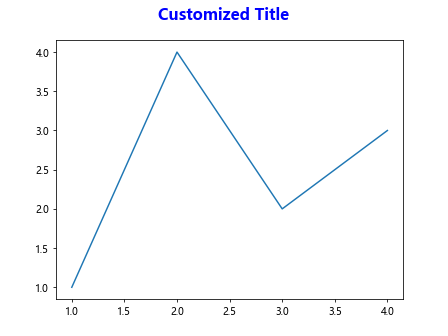
In this example, we customize the suptitle by setting the font size to 16, font weight to bold, font style to italic, and color to blue.
Adding a Suptitle to Subplots
If you have multiple subplots in a figure and want to add a suptitle that spans the entire figure, you can do so by using fig.suptitle() with plt.subplots(). Here is an example:
import matplotlib.pyplot as plt

fig, axs = plt.subplots(2, 2)
axs[0, 0].plot([1, 2, 3, 4], [1, 4, 2, 3])
axs[0, 1].plot([1, 2, 3, 4], [3, 2, 4, 1])
axs[1, 0].plot([1, 2, 3, 4], [2, 3, 1, 4])
axs[1, 1].plot([1, 2, 3, 4], [4, 1, 3, 2])

fig.suptitle('Suptitle for Subplots')
plt.show()
Output:
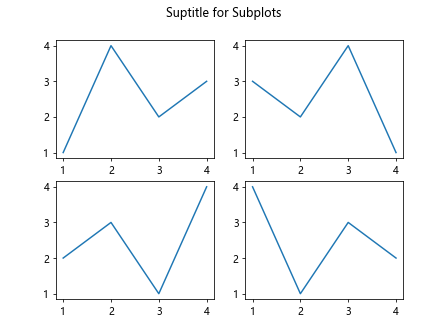
In this example, we create a 2×2 subplot grid and add a suptitle “Suptitle for Subplots” that spans the entire figure.
Aligning the Suptitle
By default, the suptitle is centered at the top of the figure. However, you can align the suptitle to the left, right, or center by using the x and y parameters of the fig.suptitle() method. Here is an example:
import matplotlib.pyplot as plt

fig, ax = plt.subplots()
ax.plot([1, 2, 3, 4], [1, 4, 2, 3])

fig.suptitle('Aligned Title', x=0.5, y=0.95, ha='center')
plt.show()
Output:
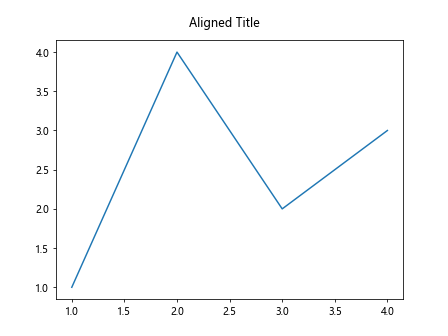
In this example, we align the suptitle to the center of the figure by setting x=0.5, y=0.95, and ha='center'.
Multiple Lines in Suptitle
If you want to display multiple lines in the suptitle, you can use \n to insert line breaks. Here is an example:
import matplotlib.pyplot as plt

fig, ax = plt.subplots()
ax.plot([1, 2, 3, 4], [1, 4, 2, 3])

fig.suptitle('Multiple\nLines\nTitle')
plt.show()
Output:
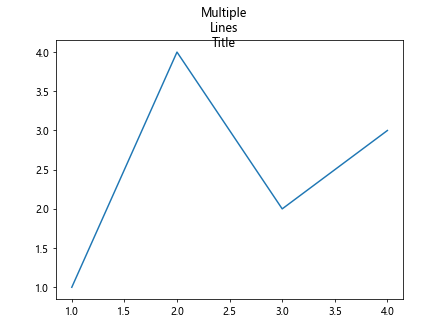
In this example, we create a suptitle with three lines by inserting \n between the lines.
Supertitle Positioning
You can adjust the position of the suptitle within the figure using the x, y, and ha parameters of the fig.suptitle() method. Here are some example positions:
- Top left corner:
fig.suptitle('Top Left Title', x=0.1, y=0.95, ha='left')
- Top right corner:
fig.suptitle('Top Right Title', x=0.9, y=0.95, ha='right')
- Centered at the top:
fig.suptitle('Centered Title', x=0.5, y=0.95, ha='center')
- Bottom center:
fig.suptitle('Bottom Center Title', x=0.5, y=0.05, ha='center')
Font Properties
You can customize the font properties of the suptitle, such as size, weight, style, and color. Here is an example:
fig.suptitle('Font Properties', fontsize=16, fontweight='bold', fontstyle='italic', color='green')
In this example, we set the font size to 16, font weight to bold, font style to italic, and color to green.
Combining Suptitle with Title and Subplots
You can combine the suptitle with individual plot titles and axis labels to create informative and visually appealing figures. Here is an example:
import matplotlib.pyplot as plt

fig, axs = plt.subplots(2, 2)

axs[0, 0].plot([1, 2, 3, 4], [1, 4, 2, 3])
axs[0, 0].set_title('Plot 1')

axs[0, 1].plot([1, 2, 3, 4], [3, 2, 4, 1])
axs[0, 1].set_title('Plot 2')

fig.suptitle('Main Title')
plt.show()
Output:
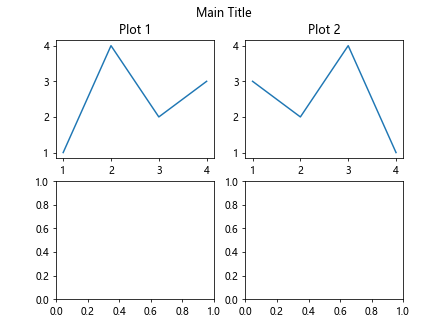
In this example, we create a 2×2 subplot grid with individual plot titles and a suptitle “Main Title”.
Conclusion
In this article, we have explored how to add a suptitle to a figure in Matplotlib. We have covered basic usage, customizations, aligning the suptitle, adding suptitle to subplots, multiple lines in suptitle, suptitle positioning, font properties, and combining suptitle with titles and subplots. By understanding how to use fig.suptitle(), you can enhance the visual appearance of your Matplotlib figures and make them more informative for your audience.