Matplotlib Figure Size
In Matplotlib, the size of a figure can be adjusted in order to create visualizations with the desired dimensions. Changing the size of a figure can be helpful in customizing the appearance of plots to better suit your needs. In this article, we will explore how to adjust the size of figures in Matplotlib.
Set Figure Size
To set the size of a figure in Matplotlib, you can use the figsize parameter in the plt.figure() function. This parameter takes a tuple of two values, representing the width and height of the figure in inches.
import matplotlib.pyplot as plt

plt.figure(figsize=(8, 6))
plt.plot([1, 2, 3, 4], [1, 4, 9, 16])
plt.title('Figure with Size 8x6')
plt.show()
Output:

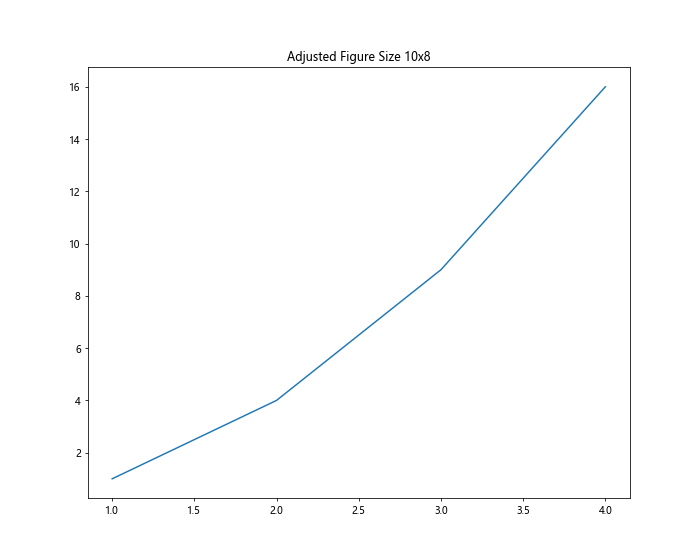
Adjust Figure Size
You can also adjust the size of an existing figure using the set_size_inches() method of the figure object. This method takes the width and height of the figure as arguments.
import matplotlib.pyplot as plt

fig, ax = plt.subplots()
ax.plot([1, 2, 3, 4], [1, 4, 9, 16])
fig.set_size_inches(10, 8)
plt.title('Adjusted Figure Size 10x8')
plt.show()
Output:
Save Figure with Specific Size
When saving a figure in Matplotlib, you can specify the size of the saved image using the figsize parameter in the savefig() function. This parameter works the same way as setting the size of a figure.
import matplotlib.pyplot as plt

plt.plot([1, 2, 3, 4], [1, 4, 9, 16])
plt.title('Save Figure with Size 12x10')
plt.savefig('figure.png', dpi=300, figsize=(12, 10))
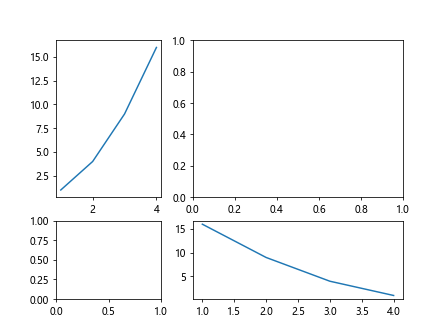
Subplots with Different Sizes
If you want to create subplots with different sizes within the same figure, you can specify the size of each subplot using the gridspec_kw parameter in the plt.subplots() function. This parameter takes a dictionary with customizable grid specifications.
import matplotlib.pyplot as plt

fig, axs = plt.subplots(2, 2, gridspec_kw={'width_ratios': [1, 2], 'height_ratios': [2, 1]})
axs[0, 0].plot([1, 2, 3, 4], [1, 4, 9, 16])
axs[1, 1].plot([1, 2, 3, 4], [16, 9, 4, 1])
plt.show()
Output:
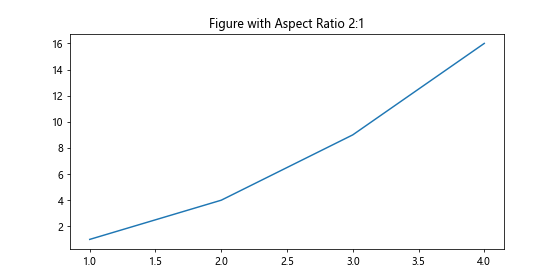
Create a Figure with Specific Aspect Ratio
In Matplotlib, you can create a figure with a specific aspect ratio by setting the figsize parameter to a tuple that maintains the desired ratio. By adjusting the width and height of the figure, you can control the aspect ratio of the plot.
import matplotlib.pyplot as plt

plt.figure(figsize=(8, 4))
plt.plot([1, 2, 3, 4], [1, 4, 9, 16])
plt.title('Figure with Aspect Ratio 2:1')
plt.show()
Output:
Save Figure with Specific Aspect Ratio
When saving a figure with a specific aspect ratio, you can set the size of the saved image to maintain the desired ratio. By adjusting the width and height of the saved image, you can control the aspect ratio of the plot.
import matplotlib.pyplot as plt

plt.figure(figsize=(10, 5))
plt.plot([1, 2, 3, 4], [1, 4, 9, 16])
plt.title('Save Figure with Aspect Ratio 2:1')
plt.savefig('figure.png', dpi=300, bbox_inches='tight')
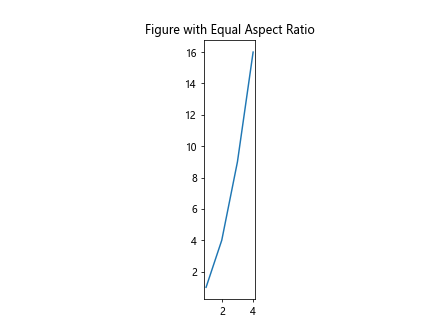
Use Aspect Parameter
Another way to control the aspect ratio of a figure in Matplotlib is by using the aspect parameter in the plt.axes() function. This parameter allows you to set the aspect ratio of the plot, adjusting the width and height based on the specified value.
import matplotlib.pyplot as plt

plt.axes(aspect='equal')
plt.plot([1, 2, 3, 4], [1, 4, 9, 16])
plt.title('Figure with Equal Aspect Ratio')
plt.show()
Output:
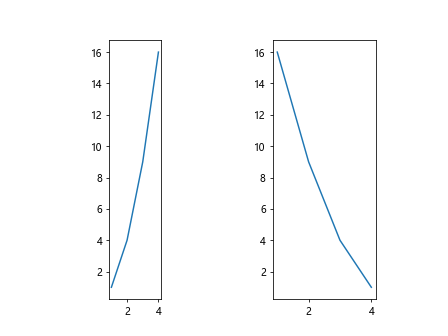
Subplots with Different Aspect Ratios
To create subplots with different aspect ratios within the same figure, you can specify the aspect ratio of each subplot using the aspect parameter in the plt.subplot() function. This parameter allows you to set the aspect ratio of each subplot independently.
import matplotlib.pyplot as plt

fig, axs = plt.subplots(1, 2)
axs[0].plot([1, 2, 3, 4], [1, 4, 9, 16])
axs[1].plot([1, 2, 3, 4], [16, 9, 4, 1])
axs[0].set_aspect('equal')
axs[1].set_aspect(0.5)
plt.show()
Output:
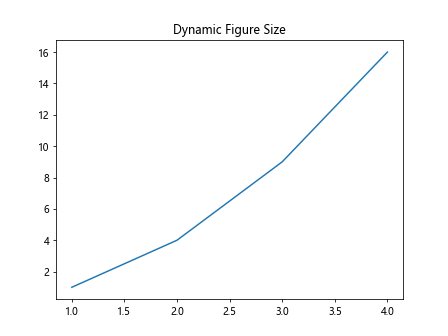
Adjust Figure Size Dynamically
In Matplotlib, you can adjust the size of a figure dynamically based on the content of the plot by setting the figsize parameter to None in the plt.figure() function. This allows the figure to resize automatically based on the content.
import matplotlib.pyplot as plt

plt.figure(figsize=None)
plt.plot([1, 2, 3, 4], [1, 4, 9, 16])
plt.title('Dynamic Figure Size')
plt.show()
Output: