Setting the Title for a Figure or Axes in Matplotlib
In Matplotlib, the title method can be used to set the title for a figure or axes in a plot. Titles help to provide context and information about the data being visualized in the plot. In this article, we will explore how to set titles for figures and axes in Matplotlib using various examples.
Setting Title for Figure
To set a title for a figure in Matplotlib, you can use the suptitle method. This method sets the title for the entire figure. Here is an example:
import matplotlib.pyplot as plt

fig = plt.figure()
fig.suptitle('Title for the Figure', fontsize=16, fontweight='bold')
plt.show()
Output:

In this example, the suptitle method is used to set the title “Title for the Figure” for the figure. You can customize the font size and weight of the title as needed.
Setting Title for Axes
To set a title for the axes in a plot, you can use the set_title method. This method sets the title for the individual axes. Here is an example:
import matplotlib.pyplot as plt

fig, ax = plt.subplots()
ax.set_title('Title for the Axes', fontsize=14, fontweight='bold')
plt.show()
Output:
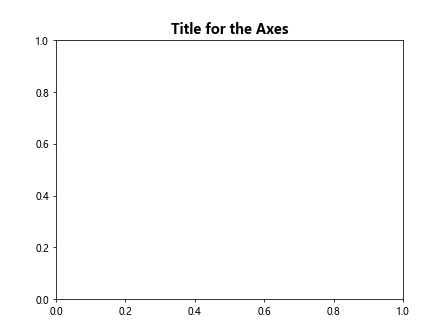
In this example, the set_title method is used to set the title “Title for the Axes” for the axes in the plot. You can also customize the font size and weight of the title.
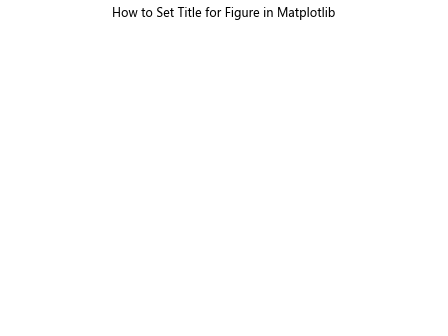
Example 1: Setting Title for Figure
import matplotlib.pyplot as plt

fig = plt.figure()
fig.suptitle('How to Set Title for Figure in Matplotlib')
plt.show()
Output:
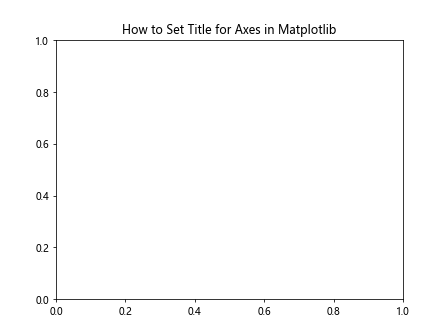
Example 2: Setting Title for Axes
import matplotlib.pyplot as plt

fig, ax = plt.subplots()
ax.set_title('How to Set Title for Axes in Matplotlib')
plt.show()
Output:
Example 3: Customizing Title Font Size and Weight
import matplotlib.pyplot as plt

fig = plt.figure()
fig.suptitle('Customized Title', fontsize=18, fontweight='bold')
plt.show()
Output:

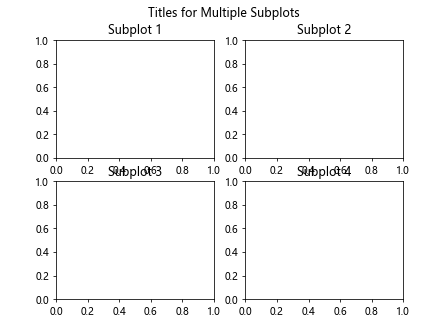
Example 4: Setting Different Titles for Multiple Subplots
import matplotlib.pyplot as plt

fig, axs = plt.subplots(2, 2)
fig.suptitle('Titles for Multiple Subplots')

for i, ax in enumerate(axs.flat):
    ax.set_title(f'Subplot {i+1}')

plt.show()
Output:
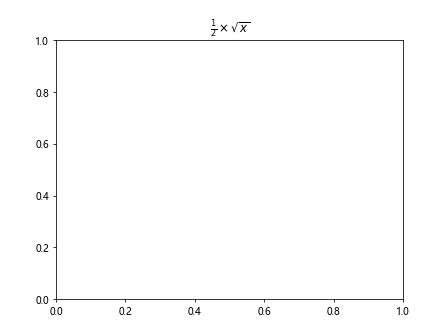
Example 5: Using LaTeX in Title
import matplotlib.pyplot as plt

plt.title(r'$\frac{1}{2} \times \sqrt{x}$')
plt.show()
Output:
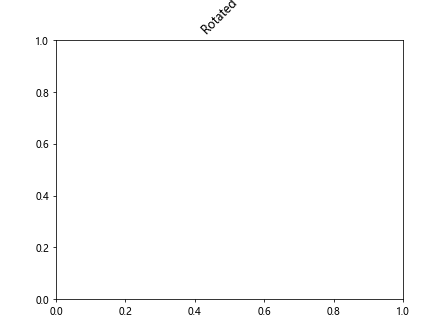
Example 6: Rotating the Title
import matplotlib.pyplot as plt

fig, ax = plt.subplots()
ax.set_title('Rotated Title', fontsize=12, rotation=45)
plt.show()
Output:
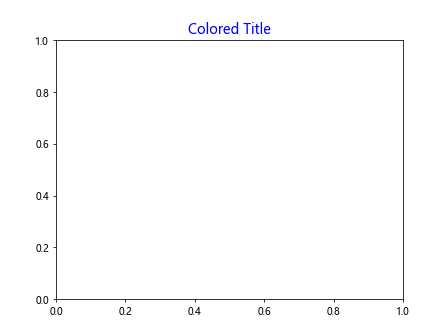
Example 7: Setting Title Color
import matplotlib.pyplot as plt

fig, ax = plt.subplots()
ax.set_title('Colored Title', fontsize=14, color='blue')
plt.show()
Output:
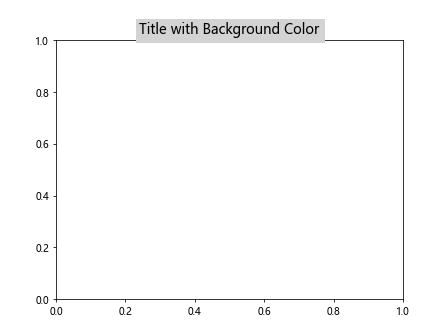
Example 8: Setting Title Background Color
import matplotlib.pyplot as plt

fig, ax = plt.subplots()
ax.set_title('Title with Background Color', fontsize=14, backgroundcolor='lightgrey')
plt.show()
Output:
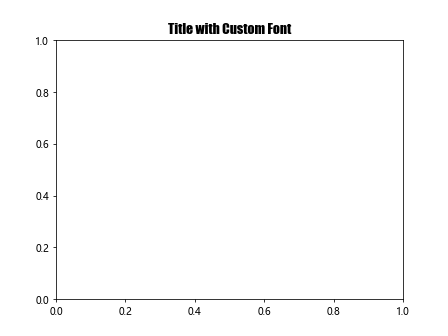
Example 9: Title with Custom Font Family
import matplotlib.pyplot as plt

fig, ax = plt.subplots()
ax.set_title('Title with Custom Font', fontsize=14, family='fantasy')
plt.show()
Output:
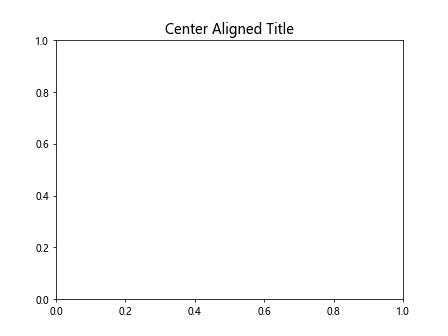
Example 10: Title Alignment
import matplotlib.pyplot as plt

fig, ax = plt.subplots()
ax.set_title('Center Aligned Title', fontsize=14, loc='center')
plt.show()
Output:
In this article, we have explored various ways to set titles for figures and axes in Matplotlib. Titles help to provide important information about the data being visualized in the plot and can be customized in terms of font size, weight, color, alignment, and more. Experiment with different options to create visually appealing and informative plots in Matplotlib.