matplotlib Fill_between
Matplotlib is a widely used plotting library in Python that provides a variety of functions for creating visualizations. One useful function offered by Matplotlib is matplotlib fill_between(), which allows you to fill the area between two curves on a plot. This can be useful for highlighting certain regions of a plot or visualizing the difference between two sets of data.
matplotlib fill_between basic syntax
The basic syntax for using matplotlib fill_between() is as follows:
import matplotlib.pyplot as plt
import numpy as np

x = np.arange(0, 10, 0.1)
y1 = np.sin(x)
y2 = np.cos(x)

plt.plot(x, y1, color='blue')
plt.plot(x, y2, color='green')
plt.fill_between(x, y1, y2, color='yellow', alpha=0.5)
plt.show()
Output:
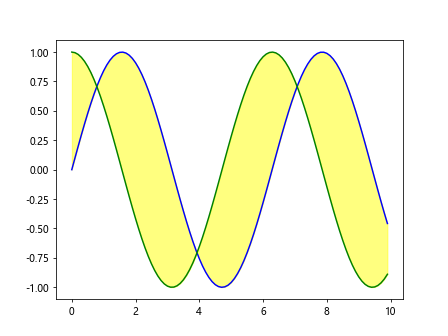
In this example, we have two sets of data y1 and y2 defined as sine and cosine of x respectively. We then plot both sets of data and use matplotlib fill_between() to fill the area between them with a yellow color and a transparency level of 0.5.
matplotlib fill_between Using where parameter
The where parameter in matplotlib fill_between() allows you to specify a condition for when the filling should occur. This can be useful when you only want to fill a specific region based on a certain criteria.
import matplotlib.pyplot as plt
import numpy as np

x = np.linspace(0, 10, 100)
y1 = np.sin(x)
y2 = np.cos(x)

plt.plot(x, y1, color='blue')
plt.plot(x, y2, color='green')
plt.fill_between(x, y1, y2, where=(y1 > y2), color='orange', alpha=0.5)
plt.show()
Output:
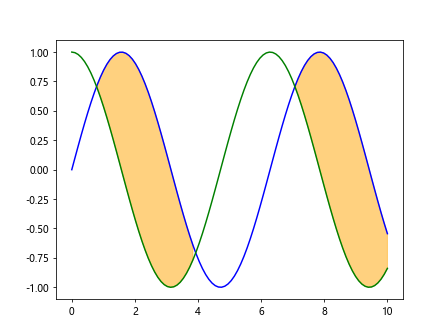
In this example, we use the where parameter to specify that the filling should only occur when y1 is greater than y2. This results in the region where y1 is above y2 being filled with an orange color.
matplotlib fill_between using interpolate parameter
The interpolate parameter in matplotlib fill_between() allows you to fill the area between two curves with a straight line instead of filling it with a solid color. This can be useful for highlighting the difference between two sets of data.
import matplotlib.pyplot as plt
import numpy as np

x = np.linspace(0, 10, 100)
y1 = np.sin(x)
y2 = np.cos(x)

plt.plot(x, y1, color='blue')
plt.plot(x, y2, color='green')
plt.fill_between(x, y1, y2, where=(y1 >= y2), color='pink', interpolate=True)
plt.show()
Output:
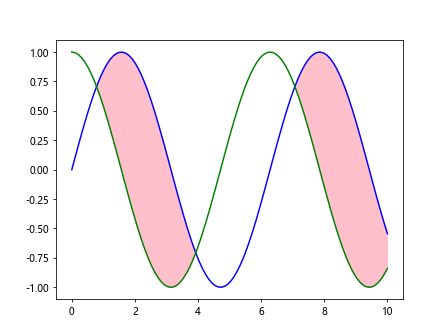
In this example, we use the interpolate parameter to fill the area between y1 and y2 with a straight line when y1 is greater than or equal to y2. This results in a pink shaded region on the plot.
Stacked fill_between in matplotlib
You can also stack multiple calls to matplotlib fill_between() to create complex shaded regions on a plot. This can be useful for visualizing multiple datasets or highlighting different regions of a plot.
import matplotlib.pyplot as plt
import numpy as np

x = np.linspace(0, 10, 100)
y1 = np.sin(x)
y2 = np.cos(x)

plt.plot(x, y1, color='blue')
plt.plot(x, y2, color='green')
plt.fill_between(x, y1, y2, where=(y1 > y2), color='orange', alpha=0.5)
plt.fill_between(x, y1, y2, where=(y1 <= y2), color='purple', alpha=0.5)
plt.show()
Output:
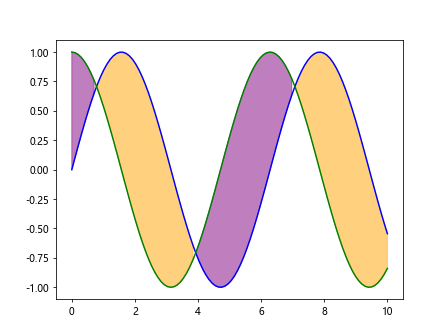
In this example, we stack two calls to matplotlib fill_between() to create a plot with two shaded regions. The orange region represents where y1 is greater than y2, while the purple region represents where y1 is less than or equal to y2.
matplotlib fill_between using step parameter
The step parameter in matplotlib fill_between() allows you to specify whether the step should be taken before or after interpolation. This can be useful for controlling how the filling is applied in step-wise data.
import matplotlib.pyplot as plt
import numpy as np

x = np.arange(1, 11)
y1 = np.array([1, 3, 2, 4, 3, 5, 4, 6, 5, 7])
y2 = np.array([0, 2, 1, 3, 2, 4, 3, 5, 4, 6])

plt.plot(x, y1, color='blue', drawstyle='steps-post')
plt.plot(x, y2, color='green', drawstyle='steps-post')
plt.fill_between(x, y1, y2, step='post', color='red', alpha=0.5)
plt.show()
Output:
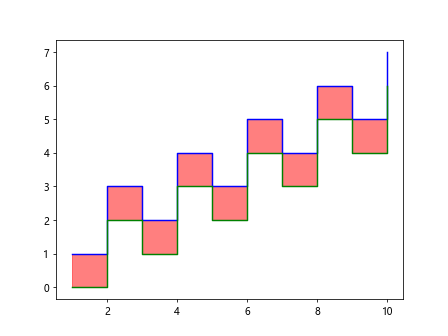
In this example, we have step-wise data represented by x, y1, and y2. We use the step='post' parameter in matplotlib fill_between() to fill the area between the step-wise curves with a red color after interpolation.
matplotlib fill_between using label parameter
The label parameter in matplotlib fill_between() allows you to provide a label for the filled area on the plot. This can be useful for creating a legend that explains the shaded regions.
import matplotlib.pyplot as plt
import numpy as np

x = np.linspace(0, 10, 100)
y1 = np.sin(x)
y2 = np.cos(x)

plt.plot(x, y1, color='blue')
plt.plot(x, y2, color='green')
plt.fill_between(x, y1, y2, label='Difference', color='yellow', alpha=0.5)
plt.legend()
plt.show()
Output:
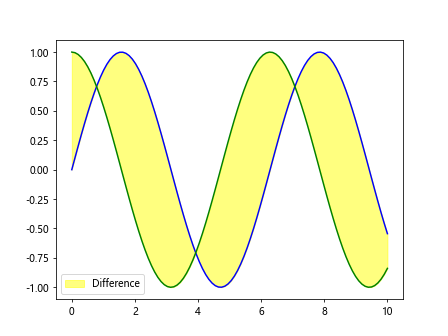
In this example, we provide a label 'Difference' for the filled area between y1 and y2. We then add a legend to the plot to explain the shaded region on the plot.
matplotlib fill_between using linewidth parameter
You can control the thickness of the line around the filled area using the linewidth parameter in matplotlib fill_between(). This can be useful for highlighting the filled region and making it stand out on the plot.
import matplotlib.pyplot as plt
import numpy as np

x = np.linspace(0, 10, 100)
y1 = np.sin(x)
y2 = np.cos(x)

plt.plot(x, y1, color='blue')
plt.plot(x, y2, color='green')
plt.fill_between(x, y1, y2, color='yellow', alpha=0.5, linewidth=2)
plt.show()
Output:
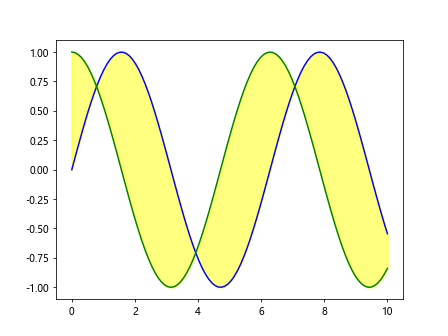
In this example, we use the linewidth=2 parameter to set the thickness of the line around the filled area between y1 and y2 to 2. This results in a thicker line outlining the shaded region on the plot.
matplotlib fill_between using edgecolor parameter
You can specify the color of the edge line around the filled area using the edgecolor parameter in matplotlib fill_between(). This can be useful for customizing the appearance of the shaded region on the plot.
import matplotlib.pyplot as plt
import numpy as np

x = np.linspace(0, 10, 100)
y1 = np.sin(x)
y2 = np.cos(x)

plt.plot(x, y1, color='blue')
plt.plot(x, y2, color='green')
plt.fill_between(x, y1, y2, color='yellow', alpha=0.5, edgecolor='black')
plt.show()
Output:
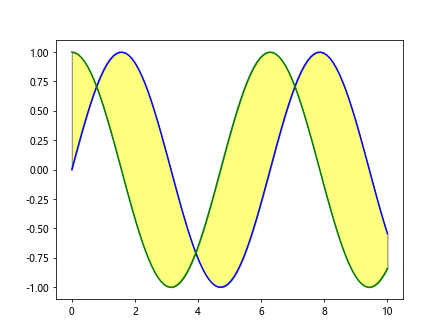
In this example, we use the edgecolor='black' parameter to set the color of the edge line around the filled area between y1 and y2 to black. This results in a black line outlining the shaded region on the plot.
matplotlib fill_between using hatch parameter
The hatch parameter in matplotlib fill_between() allows you to specify a hatching pattern for the filled area. This can be useful for adding texture to the shaded region on the plot.
import matplotlib.pyplot as plt
import numpy as np

x = np.linspace(0, 10, 100)
y1 = np.sin(x)
y2 = np.cos(x)

plt.plot(x, y1, color='blue')
plt.plot(x, y2, color='green')
plt.fill_between(x, y1, y2, color='yellow', alpha=0.5, hatch='//')
plt.show()
Output:
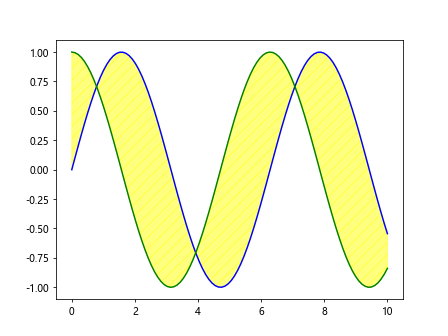
In this example, we use the hatch='//' parameter to specify a diagonal hatch pattern for the filled area between y1 and y2. This results in a textured appearance for the shaded region on the plot.
matplotlib fill_between using rasterized parameter
The rasterized parameter in matplotlib fill_between() allows you to specify whether the filled area should be rasterized or not. Rasterization can be useful for improving the rendering speed of the plot when there are many data points.
import matplotlib.pyplot as plt
import numpy as np

x = np.linspace(0, 10, 100)
y1 = np.sin(x)
y2 = np.cos(x)

plt.plot(x, y1, color='blue')
plt.plot(x, y2, color='green')
plt.fill_between(x, y1, y2, color='yellow', alpha=0.5, rasterized=True)
plt.show()
Output:
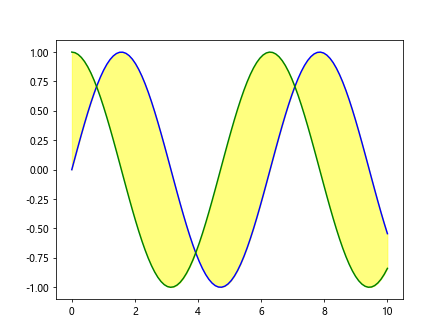
In this example, we use the rasterized=True parameter to rasterize the filled area between y1 and y2. This can help improve the rendering speed of the plot, especially when there are a large number of data points.
matplotlib fill_between using zorder parameter
You can control the stacking order of the filled area relative to other elements on the plot using the zorder parameter in matplotlib fill_between(). This can be useful for ensuring that the shaded region is displayed in the correct layer on the plot.
import matplotlib.pyplot as plt
import numpy as np

x = np.linspace(0, 10, 100)
y1 = np.sin(x)
y2 = np.cos(x)

plt.plot(x, y1, color='blue')
plt.plot(x, y2, color='green')
plt.fill_between(x, y1, y2, color='yellow', alpha=0.5, zorder=2)
plt.show()
Output:
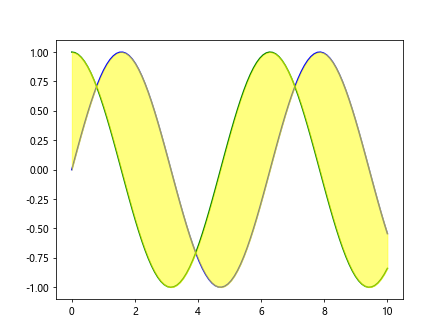
In this example, we use the zorder=2 parameter to specify that the filled area between y1 and y2 should be displayed in layer 2 on the plot. This ensures that the shaded region is correctly positioned relative to other elements on the plot.
matplotlib fill_between Conclusion
In this article, we have explored the matplotlib fill_between() function in Matplotlib and various ways to customize and enhance the filled regions on a plot. By utilizing different parameters and techniques, you can create visually appealing and informative visualizations that effectively highlight the relationships between different datasets or regions on a plot. Experiment with the examples provided and try out different combinations of parameters to create custom shaded regions that suit your specific plotting needs. Matplotlib's matplotlib fill_between() function offers a versatile tool for enhancing your plots and making them more engaging for your audience.