Line Width in Matplotlib
When creating plots using Matplotlib, it’s often necessary to customize the appearance of lines in the plot. One important aspect of line customization is adjusting the line width. The line width specifies how thick the line is in the plot. In this article, we will explore how to set the line width in Matplotlib plots.
Setting Line Width
To set the line width in Matplotlib, you can use the linewidth or lw parameter when plotting. The line width is specified in points, with the default value being 1. You can increase or decrease the line width by passing a numeric value to the linewidth parameter.
Here is an example code snippet that demonstrates how to set the line width in a simple plot:
import matplotlib.pyplot as plt

x = [1, 2, 3, 4, 5]
y = [1, 4, 9, 16, 25]

plt.plot(x, y, linewidth=2)
plt.show()
Output:
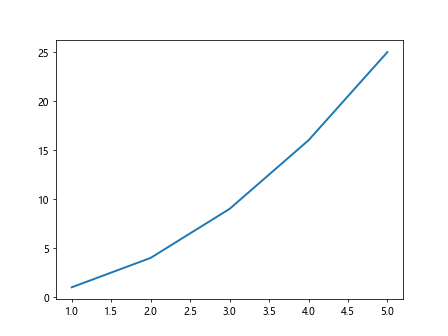
In the above code, the line width is set to 2 points for the plot. You can adjust this value to make the line thicker or thinner.
Using Line Width in Different Types of Plots
Line width can be applied to various types of plots in Matplotlib, such as line plots, scatter plots, and bar plots. Let’s look at examples of setting line width in different types of plots.
Line Plot
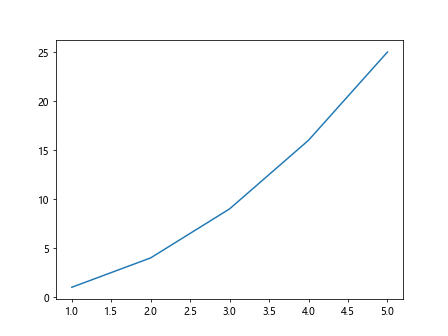
For line plots, you can specify the line width using the linewidth parameter in the plot function. Here is an example:
import matplotlib.pyplot as plt

x = [1, 2, 3, 4, 5]
y = [1, 4, 9, 16, 25]

plt.plot(x, y, linewidth=1.5)
plt.show()
Output:
Scatter Plot
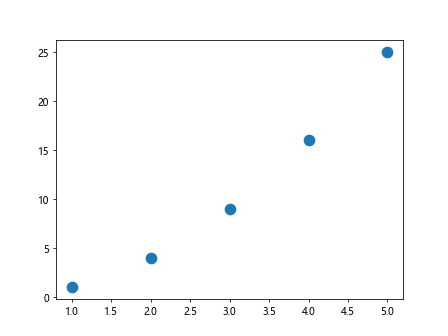
In scatter plots, the line width determines the thickness of the marker edge. You can set the line width using the linewidth parameter in the scatter function. Here’s an example:
import matplotlib.pyplot as plt

x = [1, 2, 3, 4, 5]
y = [1, 4, 9, 16, 25]

plt.scatter(x, y, s=100, linewidth=2)
plt.show()
Output:
Bar Plot
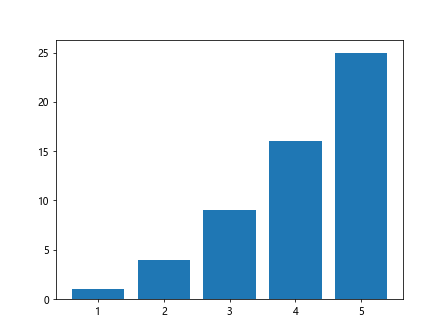
When creating bar plots, the line width controls the thickness of the edges of the bars. You can adjust the line width using the linewidth parameter in the bar function. Here’s an example:
import matplotlib.pyplot as plt

x = [1, 2, 3, 4, 5]
y = [1, 4, 9, 16, 25]

plt.bar(x, y, linewidth=2)
plt.show()
Output:
Customizing Line Widths in Subplots
If you are creating subplots in Matplotlib, you can customize the line width for each subplot individually. This allows you to have different line widths in different parts of your plot. Here’s an example code snippet that demonstrates how to set different line widths in subplots:
import matplotlib.pyplot as plt

x = [1, 2, 3, 4, 5]
y1 = [1, 4, 9, 16, 25]
y2 = [1, 2, 3, 4, 5]

fig, axs = plt.subplots(2)

axs[0].plot(x, y1, linewidth=2)
axs[1].plot(x, y2, linewidth=1)
plt.show()
Output:
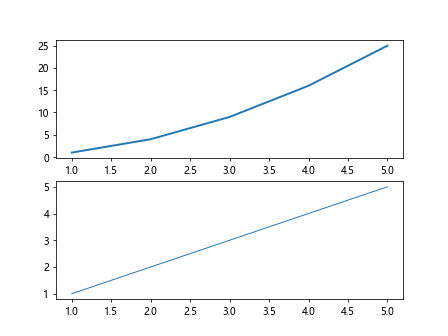
In the above code, we have two subplots with different line widths specified for each plot. This allows for more flexibility in customizing the appearance of the lines in subplots.
Conclusion
In conclusion, setting the line width in Matplotlib plots allows you to control the thickness of lines in your plots. By adjusting the line width, you can make your plots more visually appealing and emphasize important information. Experiment with different line widths to find the perfect balance for your plots.