Making Title Bold in Matplotlib
Matplotlib is a popular plotting library in Python that can be used to create a wide variety of visualizations. One common customization that users often want to make is to make the title of their plot bold. In this article, we will explore different ways to achieve this in Matplotlib.
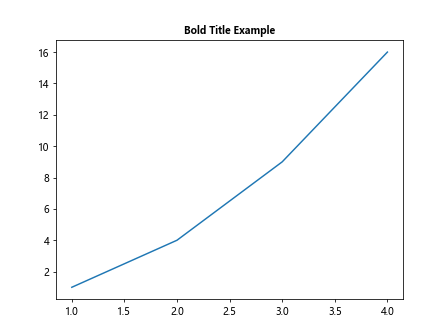
Example 1: Using fontweight Parameter
import matplotlib.pyplot as plt

plt.plot([1, 2, 3, 4], [1, 4, 9, 16])
plt.title('Bold Title Example', fontweight='bold')
plt.show()
Output:

Example 2: Using style Parameter with “bold”
import matplotlib.pyplot as plt

plt.plot([1, 2, 3, 4], [1, 4, 9, 16])
plt.title('Bold Title Example', style='bold')
plt.show()
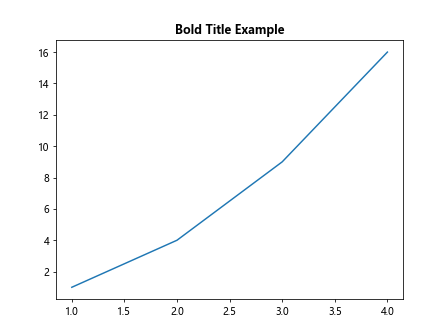
Example 3: Setting Font Properties
import matplotlib.pyplot as plt

plt.plot([1, 2, 3, 4], [1, 4, 9, 16])
plt.title('Bold Title Example', fontdict={'weight': 'bold'})
plt.show()
Output:

Example 4: Using set_fontweight Method
import matplotlib.pyplot as plt

fig, ax = plt.subplots()
ax.plot([1, 2, 3, 4], [1, 4, 9, 16])
ax.set_title('Bold Title Example')
ax.title.set_fontweight('bold')
plt.show()
Output:

Example 5: Using weight Parameter with set_font_properties
import matplotlib.pyplot as plt

fig, ax = plt.subplots()
ax.plot([1, 2, 3, 4], [1, 4, 9, 16])
ax.set_title('Bold Title Example')
ax.title.set_font_properties(weight='bold')
plt.show()
Example 6: Using FontProperties from matplotlib.font_manager
import matplotlib.pyplot as plt
from matplotlib.font_manager import FontProperties

fig, ax = plt.subplots()
ax.plot([1, 2, 3, 4], [1, 4, 9, 16])
ax.set_title('Bold Title Example', fontproperties=FontProperties(weight='bold'))
plt.show()
Output:
Example 7: Creating a Custom Font Dictionary
import matplotlib.pyplot as plt

custom_font = {'fontsize': 12, 'fontweight': 'bold'}
plt.plot([1, 2, 3, 4], [1, 4, 9, 16])
plt.title('Bold Title Example', fontdict=custom_font)
plt.show()
Output:
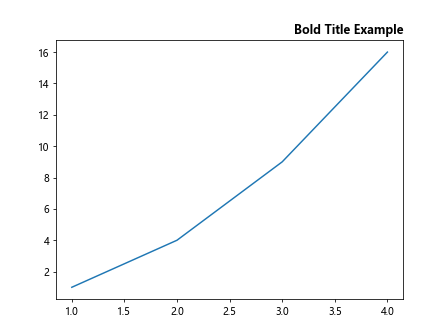
Example 8: Using loc Parameter to Position the Title
import matplotlib.pyplot as plt

plt.plot([1, 2, 3, 4], [1, 4, 9, 16])
plt.title('Bold Title Example', fontweight='bold', loc='right')
plt.show()
Output:
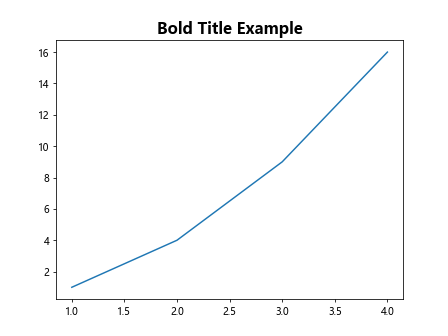
Example 9: Combining Font Properties
import matplotlib.pyplot as plt

plt.plot([1, 2, 3, 4], [1, 4, 9, 16])
plt.title('Bold Title Example', fontdict={'weight': 'bold', 'size': 16})
plt.show()
Output:
Example 10: Bold Subtitle with suptitle
import matplotlib.pyplot as plt

plt.plot([1, 2, 3, 4], [1, 4, 9, 16])
plt.suptitle('Bold Title Example', fontweight='bold')
plt.show()
Output:
Conclusion
In this article, we have explored different ways to make the title of a plot bold in Matplotlib. By using the fontweight parameter, style parameter, setting font properties, or utilizing the FontProperties from matplotlib.font_manager, you can easily customize the appearance of your plot titles. Experiment with these methods to achieve the desired visual effect in your Matplotlib plots.