Marker width in Matplotlib
Matplotlib is a powerful data visualization library in Python that allows you to create a wide variety of plots and charts. One common customization that you may need to make in your plots is adjusting the marker width. Marker width refers to the thickness of the markers used to represent individual data points in a scatter plot. In this article, we will explore how to customize the marker width in Matplotlib.
Basic Scatter Plot with Default Marker Width
To begin, let’s create a basic scatter plot using Matplotlib with the default marker width. Below is an example code snippet that demonstrates how to create a simple scatter plot with random data points:
import matplotlib.pyplot as plt
import numpy as np

# Generate random data
x = np.random.rand(50)
y = np.random.rand(50)

plt.scatter(x, y)
plt.show()
Output:
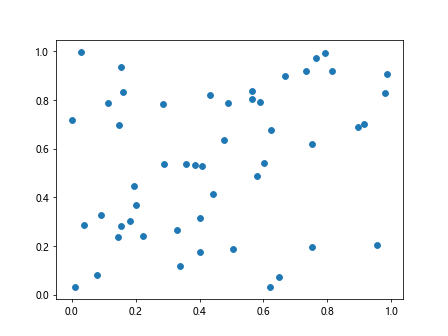
In the above code snippet, plt.scatter is used to create a scatter plot with default marker width. The resulting plot will show data points represented by markers with the default thickness.
Customizing Marker Width
To customize the marker width in Matplotlib, you can use the s parameter in the plt.scatter function. The s parameter allows you to specify the size of the markers in points^2. By adjusting the s parameter, you can control the width of the markers in your scatter plot.
Here’s an example code snippet that demonstrates how to set a custom marker width for a scatter plot:
import matplotlib.pyplot as plt
import numpy as np

# Generate random data
x = np.random.rand(50)
y = np.random.rand(50)

plt.scatter(x, y, s=100)
plt.show()
Output:
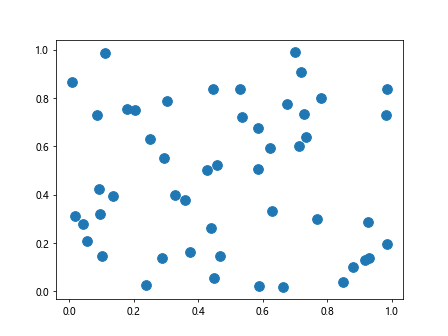
In the above code snippet, the s parameter is set to 100, which increases the marker size and width in the scatter plot.
Varying Marker Width Based on Data
Sometimes you may want to vary the marker width based on the data values. For example, you may want to create a scatter plot where the marker width is proportional to a third variable. You can achieve this by passing an array to the s parameter in plt.scatter.
Here’s a sample code snippet that demonstrates how to vary the marker width based on a third variable z:
import matplotlib.pyplot as plt
import numpy as np

# Generate random data
x = np.random.rand(50)
y = np.random.rand(50)

z = np.random.rand(50) * 100

plt.scatter(x, y, s=z)
plt.show()
Output:
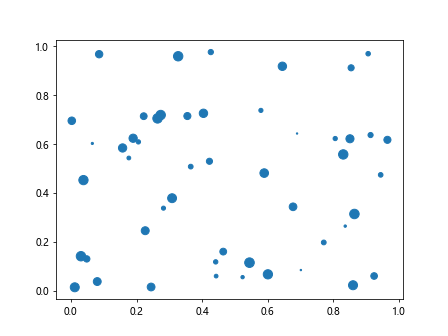
In the above code snippet, the values in the array z are used to set the marker width proportional to those values. Larger values in z will result in wider markers in the scatter plot.
Using Different Marker Styles with Custom Widths
Matplotlib offers a variety of marker styles that can be used in scatter plots. You can combine different marker styles with custom widths to create visually appealing scatter plots. Below is an example code snippet that demonstrates how to use different marker styles with custom widths:
import matplotlib.pyplot as plt
import numpy as np

# Generate random data
x = np.random.rand(50)
y = np.random.rand(50)

plt.scatter(x, y, s=100, marker='^')
plt.scatter(x + 0.1, y, s=150, marker='o')
plt.scatter(x + 0.2, y, s=200, marker='s')
plt.show()
Output:
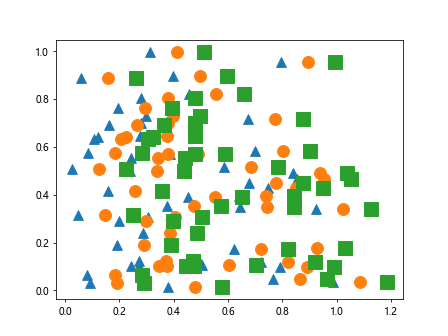
In the above code snippet, we have used three different marker styles (‘^’, ‘o’, ‘s’) with different widths to create a scatter plot with varied markers.
Adjusting Marker Edge Color and Width
In addition to customizing the marker width, you can also adjust the edge color and width of the markers in a scatter plot. The edgecolors and linewidths parameters in plt.scatter allow you to control the edge color and width of the markers, respectively.
Here’s an example code snippet that demonstrates how to adjust the marker edge color and width:
import matplotlib.pyplot as plt
import numpy as np

# Generate random data
x = np.random.rand(50)
y = np.random.rand(50)

plt.scatter(x, y, s=100, edgecolors='red', linewidths=2)
plt.show()
Output:
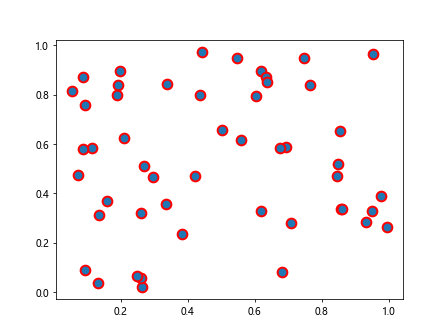
In the above code snippet, the edgecolors parameter is set to 'red' to change the edge color of the markers to red, and the linewidths parameter is set to 2 to increase the width of the marker edges.
Custom Marker Widths in 3D Scatter Plots
Matplotlib also allows you to create 3D scatter plots with custom marker widths. You can use the scatter function from the mpl_toolkits.mplot3d module to create 3D scatter plots with customized marker widths.
Here’s an example code snippet that demonstrates how to create a 3D scatter plot with custom marker widths:
from mpl_toolkits.mplot3d import Axes3D
import matplotlib.pyplot as plt
import numpy as np

# Generate random data
x = np.random.rand(50)
y = np.random.rand(50)

fig = plt.figure()
ax = fig.add_subplot(111, projection='3d')

z = np.random.rand(50) * 100

ax.scatter(x, y, z, s=100)
plt.show()
Output:
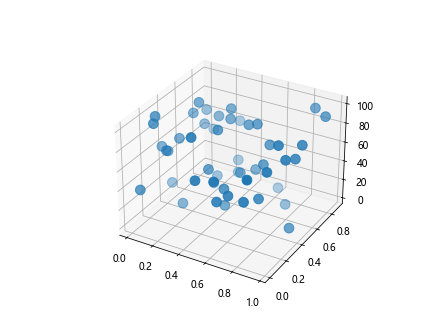
In the above code snippet, we use the scatter function from mpl_toolkits.mplot3d to create a 3D scatter plot with custom marker widths based on the array z.
Conclusion
In this article, we explored how to customize marker widths in Matplotlib scatter plots. We started by creating a basic scatter plot with default marker width and then moved on to customizing the marker width using the s parameter in the plt.scatter function. We also looked at varying marker widths based on data values, using different marker styles, adjusting marker edge color and width, and creating 3D scatter plots with custom marker widths. By following these examples, you can effectively customize marker widths in your Matplotlib plots to enhance data visualization.