Horizontal Colorbar in Matplotlib
When plotting visualizations in Matplotlib, it’s often useful to include a colorbar to provide a visual representation of the data. In this article, we will focus on how to create a horizontal colorbar in Matplotlib.
Basic Horizontal Colorbar
To create a basic horizontal colorbar in Matplotlib, you can use the colorbar function along with the orientation parameter set to ‘horizontal’.
import matplotlib.pyplot as plt
import numpy as np

# Create a sample plot
x = np.linspace(0, 10, 100)
y = np.exp(x)
plt.plot(x, y, c='b')

# Add a horizontal colorbar
plt.colorbar(orientation='horizontal')
plt.show()
Customizing the Horizontal Colorbar
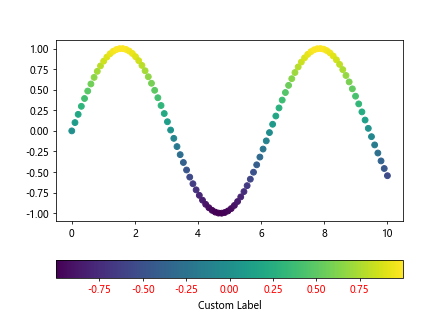
You can customize the appearance of the horizontal colorbar by changing various parameters such as size, position, and color.
import matplotlib.pyplot as plt
import numpy as np

# Create a sample plot
x = np.linspace(0, 10, 100)
y = np.sin(x)
plt.scatter(x, y, c=y, cmap='viridis')

# Add a horizontal colorbar with custom parameters
cbar = plt.colorbar(orientation='horizontal')
cbar.set_label('Custom Label')
cbar.ax.tick_params(labelcolor='r', labelsize=10)
plt.show()
Output:
Setting the Range of the Horizontal Colorbar
You can set the range of values displayed in the horizontal colorbar by customizing the vmin and vmax parameters.
import matplotlib.pyplot as plt
import numpy as np

# Create a sample plot
x = np.linspace(0, 10, 100)
y = np.cos(x)
plt.scatter(x, y, c=y, cmap='plasma')

# Add a horizontal colorbar with custom range
cbar = plt.colorbar(orientation='horizontal', ticks=[-1, 0, 1])
cbar.set_clim(vmin=-1, vmax=1)
plt.show()
Changing the Colormap of the Horizontal Colorbar
You can change the colormap of the horizontal colorbar by specifying a different colormap using the cmap parameter.
import matplotlib.pyplot as plt
import numpy as np

# Create a sample plot
x = np.linspace(0, 10, 100)
y = np.tan(x)
plt.scatter(x, y, c=y, cmap='rainbow')

# Add a horizontal colorbar with a different colormap
cbar = plt.colorbar(orientation='horizontal', ticks=[-1, 0, 1])
cbar.set_cmap('cividis')
plt.show()
Custom Colorbar Tick Labels
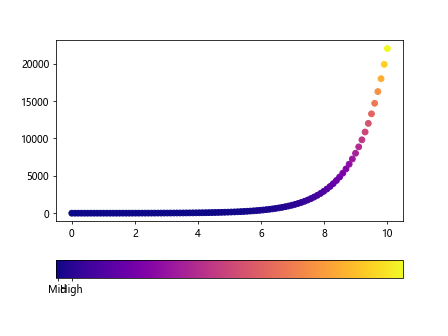
You can customize the tick labels on the horizontal colorbar to display specific values or labels.
import matplotlib.pyplot as plt
import numpy as np

# Create a sample plot
x = np.linspace(0, 10, 100)
y = np.exp(x)
plt.scatter(x, y, c=y, cmap='plasma')

# Add a horizontal colorbar with custom tick labels
cbar = plt.colorbar(orientation='horizontal', ticks=[0, 100, 1000])
cbar.ax.set_xticklabels(['Low', 'Mid', 'High'])
plt.show()
Output:
Discrete Colorbar with Custom Levels
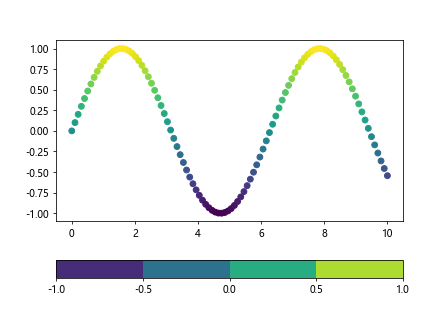
You can create a discrete horizontal colorbar with custom levels by specifying the number of levels using the boundaries parameter.
import matplotlib.pyplot as plt
import numpy as np

# Create a sample plot
x = np.linspace(0, 10, 100)
y = np.sin(x)
plt.scatter(x, y, c=y, cmap='viridis')

# Add a discrete horizontal colorbar with custom levels
cbar = plt.colorbar(orientation='horizontal', boundaries=[-1, -0.5, 0, 0.5, 1])
plt.show()
Output:
Colorbar with Logarithmic Scale
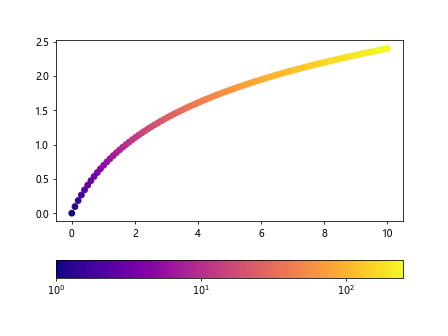
You can create a horizontal colorbar with a logarithmic scale to display data with a wide range of values.
import matplotlib.pyplot as plt
import numpy as np

# Create a sample plot
x = np.linspace(0, 10, 100)
y = np.log(x+1)
plt.scatter(x, y, c=y, cmap='plasma')

# Add a horizontal colorbar with a logarithmic scale
cbar = plt.colorbar(orientation='horizontal')
cbar.set_ticks([0, 1, 2])
cbar.set_ticklabels(['$10^0$', '$10^1$', '$10^2$'])
plt.show()
Output:
Reversing the Horizontal Colorbar
You can reverse the direction of the horizontal colorbar by setting the fraction parameter to a negative value.
import matplotlib.pyplot as plt
import numpy as np

# Create a sample plot
x = np.linspace(0, 10, 100)
y = np.exp(x)
plt.scatter(x, y, c=y, cmap='viridis')

# Add a horizontal colorbar with reversed direction
cbar = plt.colorbar(orientation='horizontal', fraction=-0.05)
plt.show()
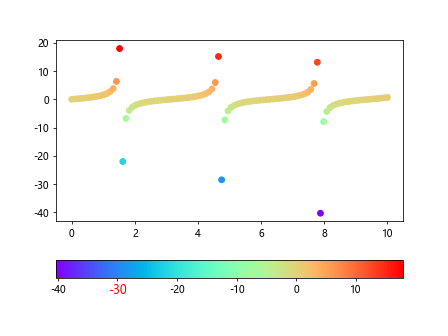
Coloring Specific Ticks on Horizontal Colorbar
You can highlight specific ticks on the horizontal colorbar by changing their color and font properties.
import matplotlib.pyplot as plt
import numpy as np

# Create a sample plot
x = np.linspace(0, 10, 100)
y = np.tan(x)
plt.scatter(x, y, c=y, cmap='rainbow')

# Add a horizontal colorbar with specific tick colors
cbar = plt.colorbar(orientation='horizontal')
cbar.ax.get_xticklabels()[2].set_color('r')
cbar.ax.get_xticklabels()[2].set_fontsize(12)
plt.show()
Output:
Horizontal Colorbar with Custom Ticks and Labels
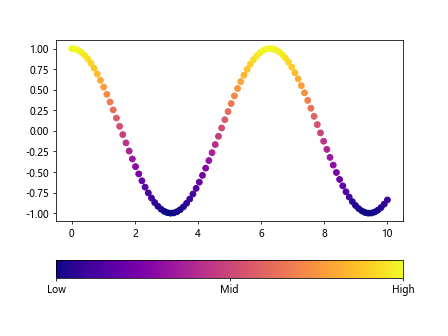
You can provide custom ticks and labels for the horizontal colorbar to display specific values.
import matplotlib.pyplot as plt
import numpy as np

# Create a sample plot
x = np.linspace(0, 10, 100)
y = np.cos(x)
plt.scatter(x, y, c=y, cmap='plasma')

# Add a horizontal colorbar with custom ticks and labels
cbar = plt.colorbar(orientation='horizontal')
ticks = [-1, 0, 1]
labels = ['Low', 'Mid', 'High']
cbar.set_ticks(ticks)
cbar.ax.set_xticklabels(labels)
plt.show()
Output:
Overlaying Multiple Plots with a Horizontal Colorbar
You can overlay multiple plots on a single figure and add a horizontal colorbar to represent the data.
import matplotlib.pyplot as plt
import numpy as np

# Create sample plots
x = np.linspace(0, 10, 100)
y1 = np.sin(x)
y2 = np.cos(x)

plt.plot(x, y1, c='b', label='Sin')
plt.plot(x, y2, c='r', label='Cos')
plt.legend()

# Add a horizontal colorbar
plt.colorbar(orientation='horizontal')
plt.show()
Hiding the Horizontal Colorbar
You can hide the horizontal colorbar when it is not needed by setting the visible parameter to false.
import matplotlib.pyplot as plt
import numpy as np

# Create a sample plot
x = np.linspace(0, 10, 100)
y = np.exp(x)
plt.scatter(x, y, c=y, cmap='viridis')

# Add a horizontal colorbar and hide it
cbar = plt.colorbar(orientation='horizontal', visible=False)
plt.show()
Conclusion
In this article, we have explored how to create and customize horizontal colorbars in Matplotlib. By using the examples provided, you can effectively display color-coded data in your visualizations. Experiment with different parameters and settings to create the perfect horizontal colorbar for your plots.