Label a Point in Matplotlib
Matplotlib is a powerful library for creating visualizations in Python. Sometimes it’s useful to label specific points in a plot to highlight important data points. In this article, we will explore different ways to label a point in Matplotlib.
Method 1: Using plt.text()
One way to label a point in Matplotlib is by using the plt.text() function. This function allows you to add text at a specific location in the plot. Here’s an example:
import matplotlib.pyplot as plt

plt.scatter(2, 3)
plt.text(2, 3, 'Point', color='red')
plt.show()
Output:
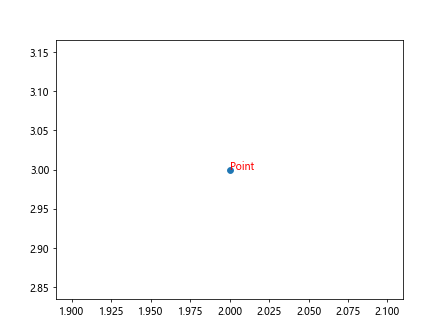
In this example, we first create a scatter plot with a single point at coordinates (2, 3). Then, we use plt.text() to add the label ‘Point’ at the same coordinates.
Method 2: Using ax.annotate()
Another way to label a point in Matplotlib is by using the ax.annotate() method of the Axes object. This method allows you to add annotations with more customization options. Here’s an example:
import matplotlib.pyplot as plt

fig, ax = plt.subplots()
ax.scatter(1, 4)
ax.annotate('Point', (1, 4), color='blue', fontsize=12)
plt.show()
Output:
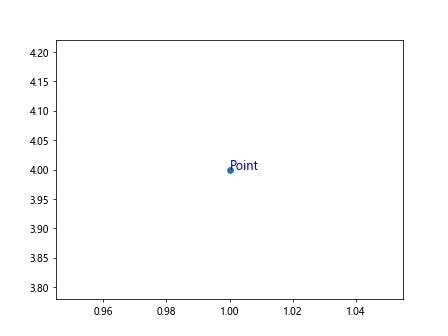
In this example, we first create a scatter plot similar to before. Then, we use ax.annotate() to add the label ‘Point’ at coordinates (1, 4) with a different color and font size.
Method 3: Adding Multiple Labels
If you want to add labels to multiple points in a plot, you can use a loop to iterate over the points and add labels for each one. Here’s an example:
import matplotlib.pyplot as plt

x = [1, 2, 3, 4]
y = [5, 6, 7, 8]
labels = ['A', 'B', 'C', 'D']

fig, ax = plt.subplots()
for i in range(len(x)):
    ax.scatter(x[i], y[i])
    ax.text(x[i], y[i], labels[i], color='green')

plt.show()
Output:
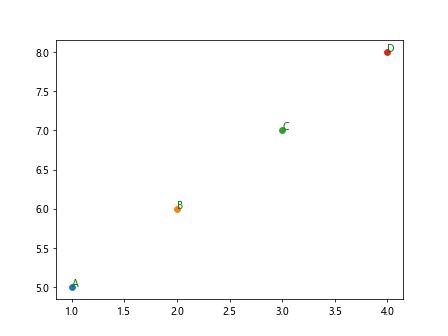
In this example, we have four points defined by the x and y lists. We also have a list of labels corresponding to each point. We then loop over each point, scatter it on the plot, and add the corresponding label.
Method 4: Customizing Labels
You can customize the appearance of labels by specifying additional parameters in the plt.text() or ax.annotate() functions. Here’s an example:
import matplotlib.pyplot as plt

plt.scatter(3, 2)
plt.text(3, 2, 'Custom Label', color='purple', fontsize=14, fontweight='bold', backgroundcolor='yellow')
plt.show()
Output:
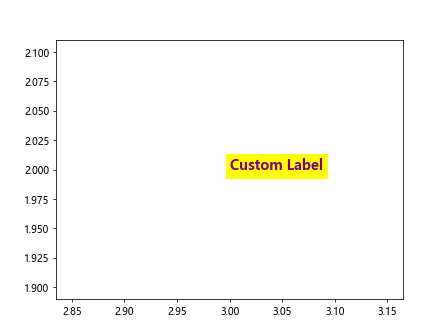
In this example, we add a custom label with different font properties such as size, weight, and background color.
Method 5: Using Arrow Annotations
Sometimes it’s helpful to include an arrow pointing to the labeled point for clarity. Matplotlib allows you to add arrow annotations using the ax.annotate() method. Here’s an example:
import matplotlib.pyplot as plt

fig, ax = plt.subplots()
ax.scatter(2, 5)
ax.annotate('Point with Arrow', (2, 5), xytext=(3, 6), arrowprops=dict(facecolor='black', shrink=0.05))
plt.show()
Output:
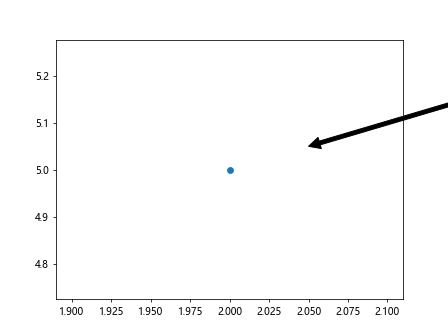
In this example, we add an arrow annotation to the labeled point with custom arrow properties such as color and size.
Method 6: Adding Labels to Specific Data Points
If you have a dataset with specific data points that you want to label, you can use conditional statements to add labels only to those points. Here’s an example:
import matplotlib.pyplot as plt

x = [1, 2, 3, 4]
y = [2, 4, 6, 8]
labels = ['Data1', 'Data2', 'Data3', 'Data4']

fig, ax = plt.subplots()
for i in range(len(x)):
    ax.scatter(x[i], y[i])
    if y[i] > 5:
        ax.text(x[i], y[i], labels[i], color='red')

plt.show()
Output:
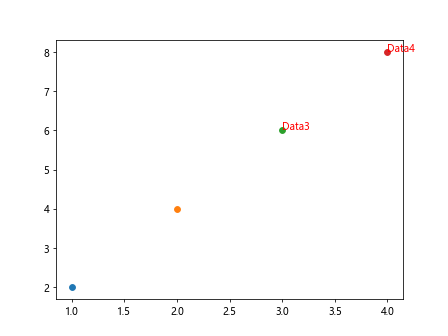
In this example, we only add labels to data points where the y-coordinate is greater than 5.
Method 7: Labeling Subplots
If you have multiple subplots in a figure and want to label specific points in each subplot, you can use the ax.annotate() method for each subplot. Here’s an example:
import matplotlib.pyplot as plt

fig, axs = plt.subplots(2, 2)

# Subplot 1
axs[0, 0].scatter(1, 2)
axs[0, 0].annotate('Point 1', (1, 2))

# Subplot 2
axs[0, 1].scatter(2, 3)
axs[0, 1].annotate('Point 2', (2, 3))

# Subplot 3
axs[1, 0].scatter(3, 4)
axs[1, 0].annotate('Point 3', (3, 4))

# Subplot 4
axs[1, 1].scatter(4, 5)
axs[1, 1].annotate('Point 4', (4, 5))

plt.show()
Output:
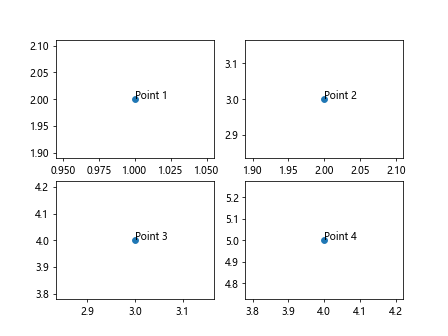
In this example, we create a figure with four subplots and label specific points in each subplot using ax.annotate().
Method 8: Labeling Using Data Coordinates
You can specify the position of the label using data coordinates or axis coordinates. By default, the position is in data coordinates, meaning the label will move when you zoom or pan the plot. Here’s an example:
import matplotlib.pyplot as plt

fig, ax = plt.subplots()
ax.plot([1, 2, 3], [4, 5, 6])
ax.text(2, 5, 'Label in Data Coordinates')

plt.show()
Output:
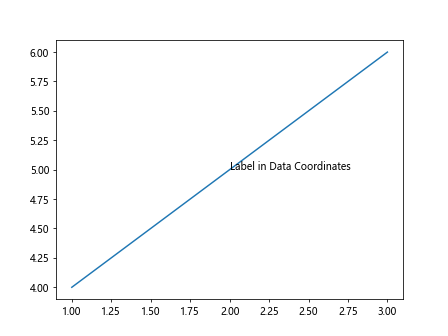
In this example, the label ‘Label in Data Coordinates’ is placed at coordinates (2, 5) in data coordinates.
Method 9: Labeling Using Axis Coordinates
If you want the label to always appear at a fixed position relative to the axes, you can specify the position using axis coordinates. Here’s an example:
import matplotlib.pyplot as plt

fig, ax = plt.subplots()
ax.plot([1, 2, 3], [4, 5, 6])
ax.text(0.5, 0.5, 'Label in Axis Coordinates', transform=ax.transAxes)

plt.show()
Output:
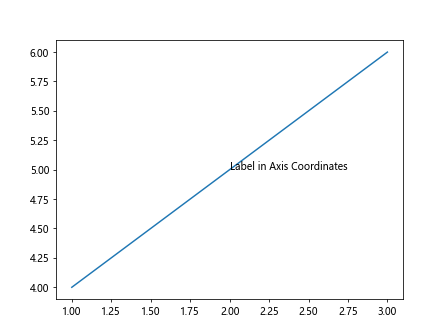
In this example, the label ‘Label in Axis Coordinates’ is placed at coordinates (0.5, 0.5) relative to the axes.
Method 10: Removing Labels
If you want to remove labels from specific points in the plot, you can use the remove() method of the Text object. Here’s an example:
import matplotlib.pyplot as plt

fig, ax = plt.subplots()
label = ax.text(2, 3, 'Remove Me', color='red')
label.remove()

plt.show()
Output:
In this example, we first create a label and then remove it using the remove() method.
Conclusion
Labeling specific points in a plot can help to draw attention to important data points or provide additional information to the viewer. In this article, we explored different methods for labeling points in Matplotlib, including using plt.text(), ax.annotate(), and customizing labels. By using these techniques, you can create more informative and visually appealing plots in Matplotlib.