Label Font Size in Matplotlib
Matplotlib is a popular Python library used for creating visualizations such as plots, charts, and graphs. One important aspect of customizing your visualizations in Matplotlib is changing the font size of the labels. In this article, we will explore how to adjust the font size of labels in Matplotlib plots.
Setting Label Font Size
You can set the font size of labels in Matplotlib plots using the fontsize parameter in the xlabel() and ylabel() functions. Here is an example code snippet that demonstrates how to adjust the font size of labels:
import matplotlib.pyplot as plt

plt.plot([1, 2, 3, 4], [1, 4, 9, 16])
plt.xlabel('X-axis label', fontsize=12)
plt.ylabel('Y-axis label', fontsize=12)
plt.show()
Output:
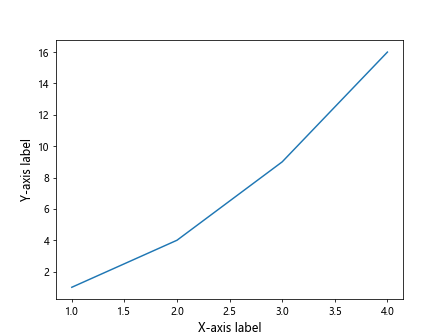
In the code above, we set the font size of both the x-axis and y-axis labels to 12 using the fontsize parameter.
Customizing Tick Label Font Size
You can also customize the font size of tick labels on the axes in Matplotlib plots. This can be achieved by setting the fontsize parameter in the xticks() and yticks() functions. Here is an example code snippet that demonstrates how to adjust the font size of tick labels:
import matplotlib.pyplot as plt

plt.plot([1, 2, 3, 4], [1, 4, 9, 16])
plt.xticks(fontsize=10)
plt.yticks(fontsize=10)
plt.show()
Output:
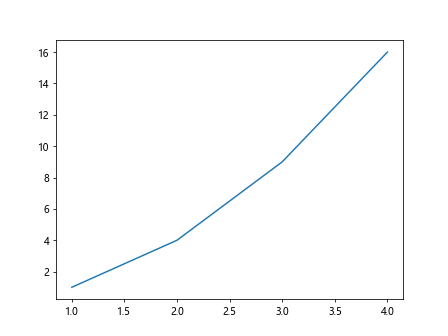
In the code above, we set the font size of both the x-axis and y-axis tick labels to 10 using the fontsize parameter.
Changing Global Font Size
If you want to change the global font size of all text elements in a Matplotlib plot, you can set the font.size parameter in the rcParams. Here is an example code snippet that demonstrates how to change the global font size:
import matplotlib.pyplot as plt
plt.rcParams.update({'font.size': 14})

plt.plot([1, 2, 3, 4], [1, 4, 9, 16])
plt.xlabel('X-axis label')
plt.ylabel('Y-axis label')
plt.show()
Output:
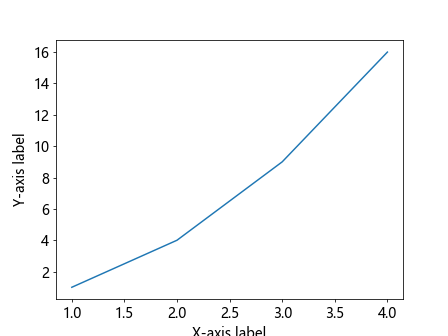
In the code above, we set the global font size to 14, which will affect all text elements in the plot.
Adjusting Legend Font Size
You can also change the font size of the legend in a Matplotlib plot using the fontsize parameter in the legend() function. Here is an example code snippet that demonstrates how to adjust the font size of the legend:
import matplotlib.pyplot as plt

plt.plot([1, 2, 3, 4], [1, 4, 9, 16], label='Line 1')
plt.legend(fontsize=12)
plt.show()
Output:
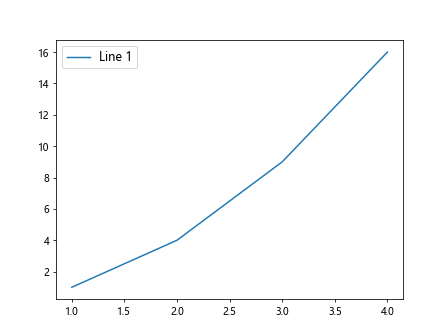
In the code above, we set the font size of the legend to 12 using the fontsize parameter in the legend() function.
Customizing Title Font Size
To change the font size of the title in a Matplotlib plot, you can use the fontsize parameter in the title() function. Here is an example code snippet that demonstrates how to adjust the font size of the title:
import matplotlib.pyplot as plt

plt.plot([1, 2, 3, 4], [1, 4, 9, 16])
plt.title('Plot Title', fontsize=16)
plt.show()
Output:
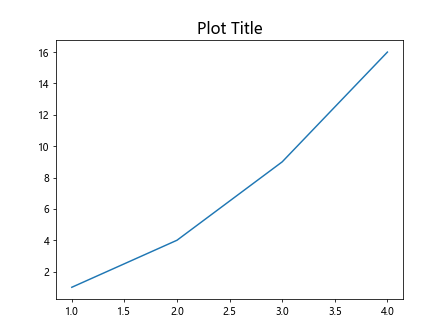
In the code above, we set the font size of the title to 16 using the fontsize parameter in the title() function.
Adjusting Axis Label Font Size
You can also customize the font size of the axis labels in a Matplotlib plot using the fontsize parameter in the ax.set_xlabel() and ax.set_ylabel() functions. Here is an example code snippet that demonstrates how to adjust the font size of axis labels:
import matplotlib.pyplot as plt

fig, ax = plt.subplots()
ax.plot([1, 2, 3, 4], [1, 4, 9, 16])
ax.set_xlabel('X-axis label', fontsize=14)
ax.set_ylabel('Y-axis label', fontsize=14)
plt.show()
Output:
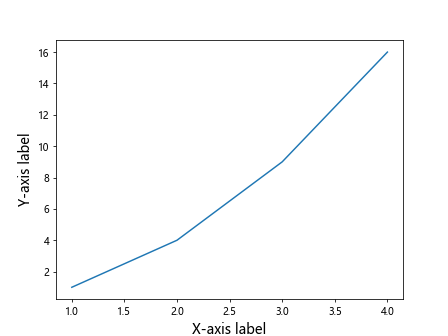
In the code above, we set the font size of both the x-axis and y-axis labels to 14 using the fontsize parameter in the ax.set_xlabel() and ax.set_ylabel() functions.
Changing Font Size of Text Annotations
If you want to adjust the font size of text annotations in a Matplotlib plot, you can use the fontsize parameter in the annotation() function. Here is an example code snippet that demonstrates how to change the font size of text annotations:
import matplotlib.pyplot as plt

plt.plot([1, 2, 3, 4], [1, 4, 9, 16])
plt.annotate('Annotation', xy=(2, 8), fontsize=10)
plt.show()
Output:
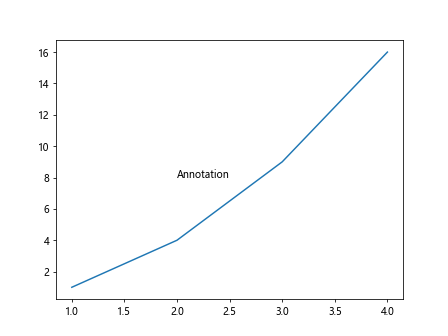
In the code above, we set the font size of the text annotation to 10 using the fontsize parameter in the annotate() function.
Adjusting Font Size of Colorbar Labels
You can also customize the font size of colorbar labels in a Matplotlib plot using the fontsize parameter in the colorbar() function. Here is an example code snippet that demonstrates how to adjust the font size of colorbar labels:
import matplotlib.pyplot as plt
import numpy as np

data = np.random.rand(10, 10)
plt.imshow(data)
plt.colorbar().set_label('Colorbar', fontsize=12)
plt.show()
Output:
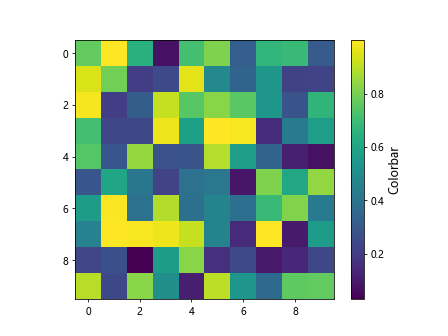
In the code above, we set the font size of the colorbar label to 12 using the fontsize parameter in the set_label() function.
Changing Font Size of Text Elements
If you need to adjust the font size of other text elements such as annotations, titles, and legends in a Matplotlib plot, you can use the set_fontsize() function. Here is an example code snippet that demonstrates how to change the font size of text elements:
import matplotlib.pyplot as plt

plt.plot([1, 2, 3, 4], [1, 4, 9, 16])
plt.xlabel('X-axis label')
plt.xticks(fontsize=12)
plt.title('Plot Title')
plt.show()
Output:
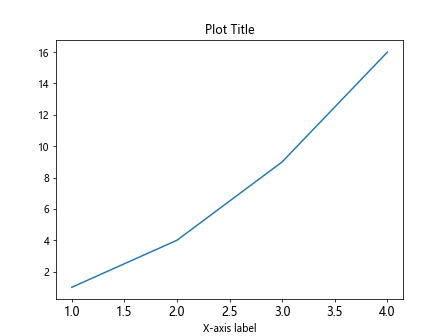
In the code above, we set the font size of x-axis tick labels, the title, and the x-axis label to 12 using the fontsize parameter in the respective functions.
Adjusting Font Size of Axis Titles
To change the font size of axis titles in a Matplotlib plot, you can use the fontdict parameter in the set_title() function. Here is an example code snippet that demonstrates how to adjust the font size of axis titles:
import matplotlib.pyplot as plt

fig, ax = plt.subplots()
ax.plot([1, 2, 3, 4], [1, 4, 9, 16])
ax.set_title('Plot Title', fontdict={'fontsize': 16})
plt.show()
Output:
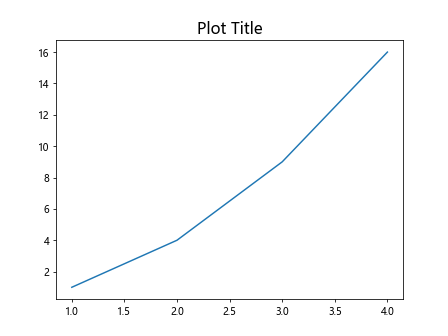
In the code above, we set the font size of the axis title to 16 using the fontdict parameter in the set_title() function.
Customizing Font Size of Grid Labels
You can also customize the font size of grid labels in a Matplotlib plot by setting the fontsize parameter in the grid() function. Here is an example code snippet that demonstrates how to adjust the font size of grid labels:
import matplotlib.pyplot as plt

plt.plot([1, 2, 3, 4], [1, 4, 9, 16])
plt.grid(True)
plt.grid(axis='x', fontsize=10)
plt.grid(axis='y', fontsize=10)
plt.show()
In the code above, we set the font size of both x-axis and y-axis grid labels to 10 using the fontsize parameter in the grid() function.
By using the various techniques and parameters provided in this article, you can easily adjust the font size of labels in Matplotlib plots to create visually appealing and informative visualizations. Experiment with different font sizes and styles to find the perfect customization for your plots.