Adding Labels to Points in Matplotlib
Matplotlib is a widely used library for creating static, animated, and interactive visualizations in Python. One common task when creating plots is to add labels to data points to provide additional information or context. In this article, we will explore different ways to add labels to points in Matplotlib.
1. Adding Text Labels to Points
You can add text labels to points in Matplotlib using the text() function. Below is an example of how to add text labels to several points on a scatter plot:
import matplotlib.pyplot as plt

x = [1, 2, 3, 4, 5]
y = [2, 3, 5, 7, 11]
labels = ['A', 'B', 'C', 'D', 'E']

plt.scatter(x, y)

for i, txt in enumerate(labels):
    plt.text(x[i], y[i], txt)

plt.show()
Output:
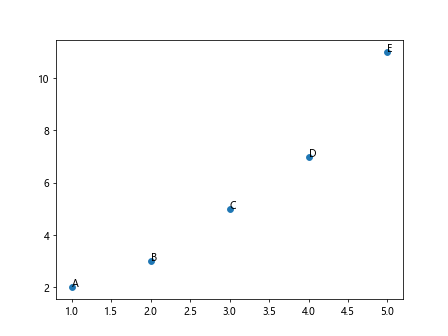
In this example, we create a scatter plot with five points represented by the coordinates in the x and y lists. We then loop through the labels list and use the text() function to add text labels at the corresponding coordinates.
2. Adding Custom Labels to Points
You can customize the appearance of text labels by specifying additional parameters in the text() function. For example, you can control the font size, font weight, color, and alignment of the labels. Here is an example:
import matplotlib.pyplot as plt

x = [1, 2, 3, 4, 5]
y = [2, 3, 5, 7, 11]
labels = ['A', 'B', 'C', 'D', 'E']

plt.scatter(x, y)

for i, txt in enumerate(labels):
    plt.text(x[i], y[i], txt, fontsize=12, fontweight='bold', color='red', ha='center', va='bottom')

plt.show()
Output:
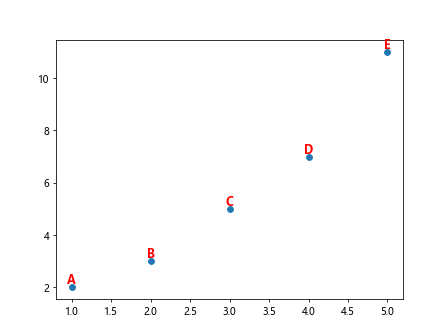
In this example, we customize the appearance of the text labels by specifying a font size of 12, a bold font weight, red color, and center horizontal alignment and bottom vertical alignment.
3. Adding Annotations to Points
Another way to add labels to points in Matplotlib is to use annotations. Annotations provide more flexibility in positioning and formatting the text labels. Here is an example of adding annotations to points on a scatter plot:
import matplotlib.pyplot as plt

x = [1, 2, 3, 4, 5]
y = [2, 3, 5, 7, 11]
labels = ['A', 'B', 'C', 'D', 'E']

plt.scatter(x, y)

for i, txt in enumerate(labels):
    plt.annotate(txt, (x[i], y[i]), xytext=(5, 5), textcoords='offset points', arrowprops=dict(arrowstyle='->'))

plt.show()
Output:
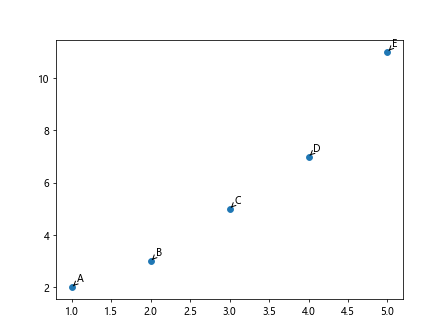
In this example, we use the annotate() function to add annotations to the points with specified text and coordinates. We also specify the text offset, arrow properties, and text coordinate system.
4. Adding Labels to Specific Points
Sometimes you may only want to add labels to specific points on a plot. You can achieve this by adding conditional statements inside the loop that adds the labels. Here is an example:
import matplotlib.pyplot as plt

x = [1, 2, 3, 4, 5]
y = [2, 3, 5, 7, 11]
labels = ['A', 'B', 'C', 'D', 'E']

plt.scatter(x, y)

for i, txt in enumerate(labels):
    if x[i] % 2 == 0:
        plt.text(x[i], y[i], txt)

plt.show()
Output:
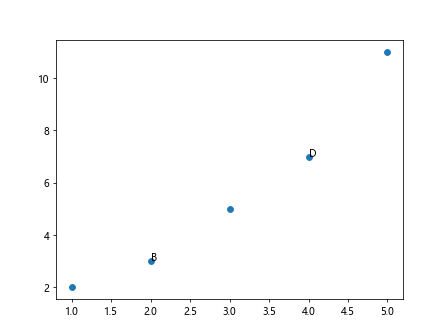
In this example, we only add labels to points where the x-coordinate is even by including a conditional statement inside the loop that checks if x[i] % 2 == 0.
5. Adding Labels with Rotation
You can rotate text labels in Matplotlib to adjust their orientation on the plot. Here is an example of adding rotated labels to points:
import matplotlib.pyplot as plt

x = [1, 2, 3, 4, 5]
y = [2, 3, 5, 7, 11]
labels = ['A', 'B', 'C', 'D', 'E']

plt.scatter(x, y)

for i, txt in enumerate(labels):
    plt.text(x[i], y[i], txt, rotation=45)

plt.show()
Output:
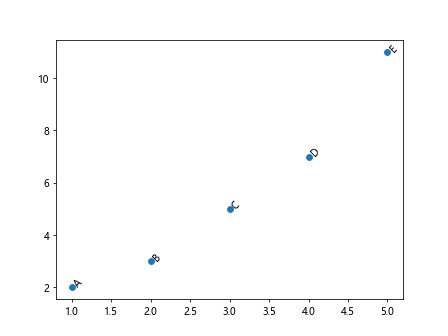
In this example, we rotate the text labels by specifying the rotation parameter in the text() function. The value 45 corresponds to a rotation angle of 45 degrees.
6. Adding Labels with Background Color
You can add background color to text labels in Matplotlib to make them stand out on the plot. Here is an example of adding labels with a background color:
import matplotlib.pyplot as plt

x = [1, 2, 3, 4, 5]
y = [2, 3, 5, 7, 11]
labels = ['A', 'B', 'C', 'D', 'E']

plt.scatter(x, y)

for i, txt in enumerate(labels):
    plt.text(x[i], y[i], txt, bbox=dict(facecolor='yellow', alpha=0.5))

plt.show()
Output:
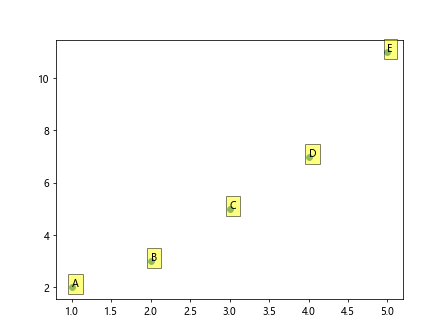
In this example, we add a yellow background color with 50% transparency to the text labels by specifying the bbox parameter in the text() function.
7. Adding Labels with Arrow
You can add arrows to annotations in Matplotlib to connect the text labels to specific points on the plot. Here is an example of adding labels with arrows:
import matplotlib.pyplot as plt

x = [1, 2, 3, 4, 5]
y = [2, 3, 5, 7, 11]
labels = ['A', 'B', 'C', 'D', 'E']

plt.scatter(x, y)

for i, txt in enumerate(labels):
    plt.annotate(txt, (x[i], y[i]), xytext=(5, 5), textcoords='offset points', arrowprops=dict(arrowstyle='->'))

plt.show()
Output:
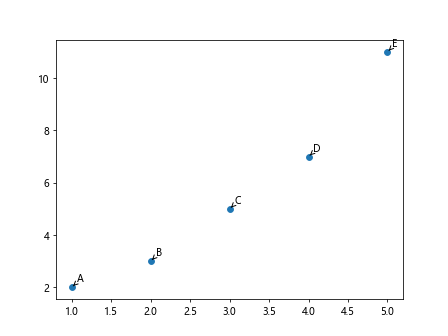
In this example, we specify arrow properties in the annotate() function to add arrows connecting the annotations to the points on the plot.
8. Adding Labels with Transparency
You can adjust the transparency of text labels in Matplotlib to control their visibility on the plot. Here is an example of adding transparent labels to points:
import matplotlib.pyplot as plt

x = [1, 2, 3, 4, 5]
y = [2, 3, 5, 7, 11]
labels = ['A', 'B', 'C', 'D', 'E']

plt.scatter(x, y)

for i, txt in enumerate(labels):
    plt.text(x[i], y[i], txt, alpha=0.7)

plt.show()
Output:
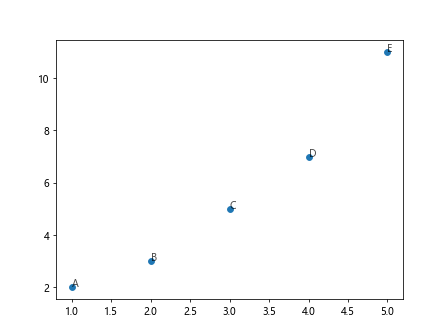
In this example, we specify an alpha value of 0.7 in the text() function to make the text labels 70% transparent.
9. Adding Labels with Shadow
You can add shadows to text labels in Matplotlib to create a visual effect of depth or prominence. Here is an example of adding labels with shadows:
import matplotlib.pyplot as plt

x = [1, 2, 3, 4, 5]
y = [2, 3, 5, 7, 11]
labels = ['A', 'B', 'C', 'D', 'E']

plt.scatter(x, y)

for i, txt in enumerate(labels):
    plt.text(x[i], y[i], txt, shadow=True)

plt.show()
In this example, we enable the shadow effect in the text() function by setting the shadow parameter to True.
10. Adding Labels with Border
You can add borders to text labels in Matplotlib to make them visually distinct from the plot background. Here is an example of adding labels with borders:
import matplotlib.pyplot as plt

x = [1, 2, 3, 4, 5]
y = [2, 3, 5, 7, 11]
labels = ['A', 'B', 'C', 'D', 'E']

plt.scatter(x, y)

for i, txt in enumerate(labels):
    plt.text(x[i], y[i], txt, bbox=dict(facecolor='none', edgecolor='black', boxstyle='round,pad=0.5'))

plt.show()
Output:
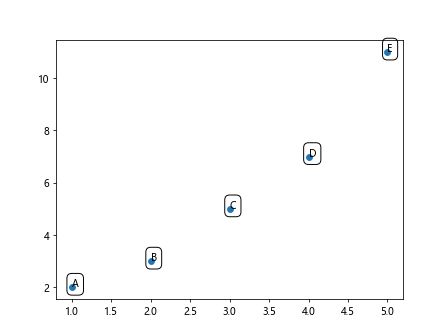
In this example, we add a black border to the text labels by specifying the bbox parameter with an edge color of black and a round box style with padding of 0.5.
Conclusion
In this article, we have explored various ways to add labels to points in Matplotlib. We have covered text labels, custom labels, annotations, and different customization options for enhancing the appearance of labels on plots. By using these techniques, you can effectively communicate information and context within your visualizations. Experiment with different settings and styles to find the best approach for labeling points in your plots.