Legend Location in Matplotlib
In Matplotlib, legends are used to label the plot elements and provide a visual aid for understanding the plot. The location of the legend can be customized to best fit the plot layout. In this article, we will explore different ways to specify the location of the legend in Matplotlib.
Default Legend Location
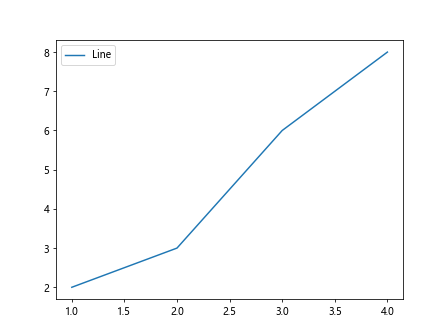
By default, Matplotlib will automatically place the legend at the best location within the plot area to avoid overlapping with other elements. This is usually in the upper-right corner of the plot.
import matplotlib.pyplot as plt

x = [1, 2, 3, 4]
y = [2, 3, 6, 8]

plt.plot(x, y, label='Line')
plt.legend()

plt.show()
Output:
Explicitly Specifying Legend Location
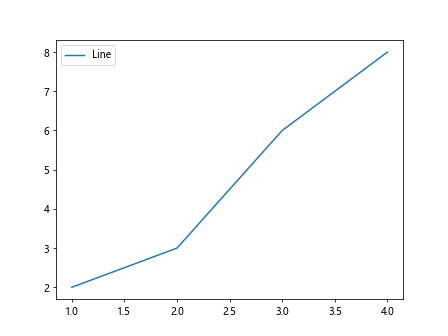
If you want to specify the location of the legend explicitly, you can use the loc parameter in the legend() function. The loc parameter takes a string or an integer representing the desired location.
import matplotlib.pyplot as plt

x = [1, 2, 3, 4]
y = [2, 3, 6, 8]

plt.plot(x, y, label='Line')
plt.legend(loc='upper left')

plt.show()
Output:
Here are some commonly used location strings in Matplotlib:
- ‘best’
- ‘upper right’
- ‘upper left’
- ‘lower left’
- ‘lower right’
- ‘right’
- ‘center left’
- ‘center right’
- ‘lower center’
- ‘upper center’
- ‘center’
Legend Outside the Plot Area
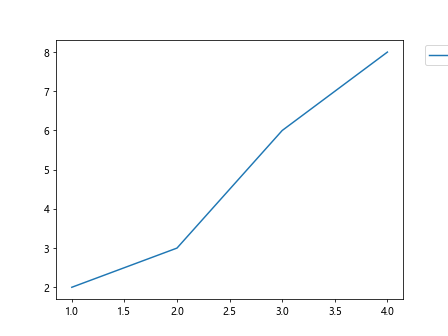
If you want the legend to be placed outside of the plot area, you can use the bbox_to_anchor parameter to specify the position relative to the plot area.
import matplotlib.pyplot as plt

x = [1, 2, 3, 4]
y = [2, 3, 6, 8]

plt.plot(x, y, label='Line')
plt.legend(loc='upper left', bbox_to_anchor=(1.05, 1))

plt.show()
Output:
Customizing Legend Appearance
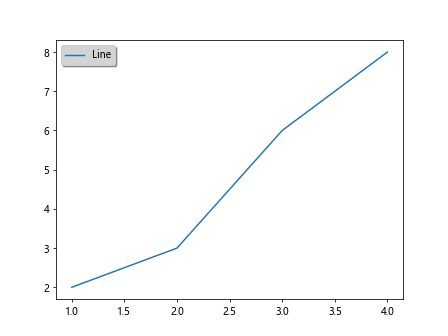
You can further customize the appearance of the legend by changing the background color, border, shadow, and more.
import matplotlib.pyplot as plt

x = [1, 2, 3, 4]
y = [2, 3, 6, 8]

plt.plot(x, y, label='Line')
plt.legend(loc='upper left', facecolor='lightgray', shadow=True)

plt.show()
Output:
Multiple Legends
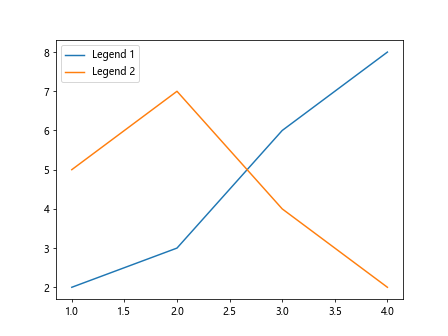
In some cases, you may want to have multiple legends in a single plot. This can be achieved by calling the legend() function multiple times with different labels.
import matplotlib.pyplot as plt

x = [1, 2, 3, 4]
y = [2, 3, 6, 8]

plt.plot(x, y, label='Line 1')
plt.plot(x, [5, 7, 4, 2], label='Line 2')
plt.legend(loc='upper left')
plt.legend(['Legend 1', 'Legend 2'])

plt.show()
Output:
Overlapping Legends
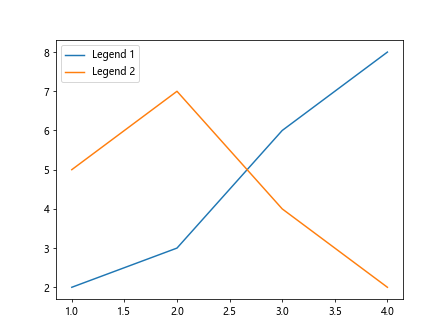
If you have multiple legends that overlap with each other, you can adjust the spacing using the bbox_to_anchor and borderaxespad parameters.
import matplotlib.pyplot as plt

x = [1, 2, 3, 4]
y = [2, 3, 6, 8]

plt.plot(x, y, label='Line 1')
plt.plot(x, [5, 7, 4, 2], label='Line 2')
plt.legend(loc='upper left', bbox_to_anchor=(0.5, 1), borderaxespad=0)
plt.legend(['Legend 1', 'Legend 2'])

plt.show()
Output:
Legend Title
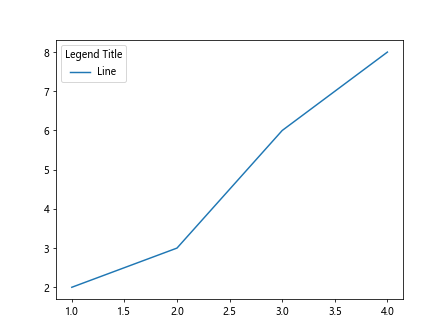
You can add a title to the legend to provide additional information about the plotted data.
import matplotlib.pyplot as plt

x = [1, 2, 3, 4]
y = [2, 3, 6, 8]

plt.plot(x, y, label='Line')
plt.legend(title='Legend Title')

plt.show()
Output:
Legend with Fancy Box
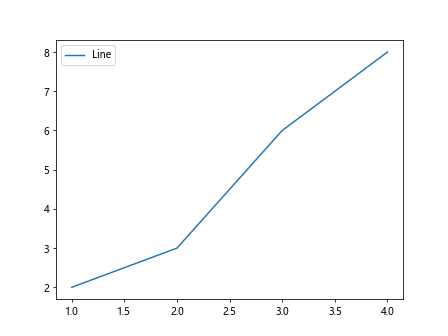
You can create a legend with a fancy box style by setting the fancybox parameter to True.
import matplotlib.pyplot as plt

x = [1, 2, 3, 4]
y = [2, 3, 6, 8]

plt.plot(x, y, label='Line')
plt.legend(fancybox=True)

plt.show()
Output:
Adding Legend to Subplots
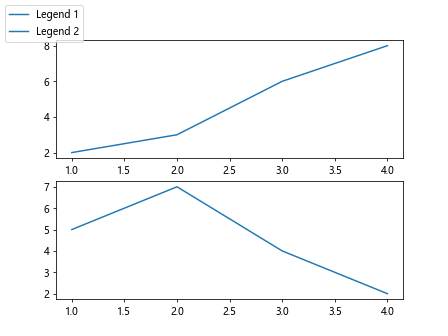
If you have multiple subplots in a figure, you can add a single legend that covers all the subplots by using the figlegend() function.
import matplotlib.pyplot as plt

x = [1, 2, 3, 4]
y = [2, 3, 6, 8]

fig, ax = plt.subplots(2)
ax[0].plot(x, y, label='Line 1')
ax[1].plot(x, [5, 7, 4, 2], label='Line 2')

fig.legend(['Legend 1', 'Legend 2'], loc='upper left')

plt.show()
Output:
Legend with Custom Handles
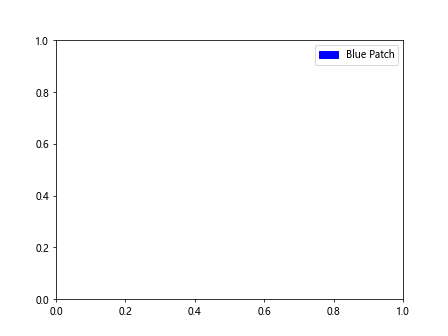
You can customize the legend handles by passing a list of artists or patches to the handles parameter.
import matplotlib.patches as mpatches
import matplotlib.pyplot as plt

x = [1, 2, 3, 4]
y = [2, 3, 6, 8]

patch = mpatches.Patch(color='blue', label='Blue Patch')
plt.legend(handles=[patch])

plt.show()
Output:
Conclusion
In this article, we have explored different ways to specify the location of the legend in Matplotlib. By customizing the legend location and appearance, you can ensure that your plots are easy to interpret and visually appealing. Experiment with the various options discussed here to create informative and visually pleasing plots in Matplotlib.