Legend Position in Matplotlib
In Matplotlib, legends are used to identify different elements of a plot, such as lines, markers, or shapes. The location of the legend within a plot can be customized using the loc parameter. In this article, we will explore various ways to adjust the position of the legend in Matplotlib.
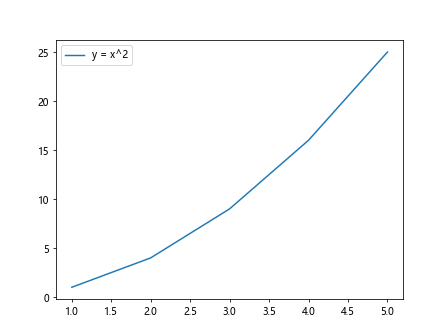
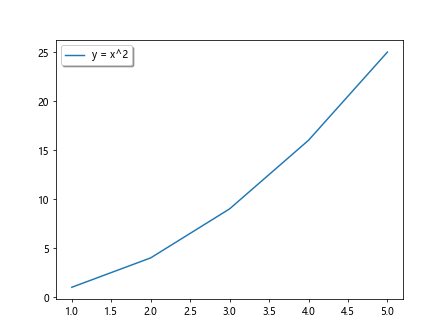
1. Default Legend Position
By default, Matplotlib places the legend in the “best” location, which is determined automatically based on the size and layout of the plot.
import matplotlib.pyplot as plt

x = [1, 2, 3, 4, 5]
y = [1, 4, 9, 16, 25]

plt.plot(x, y, label='y = x^2')
plt.legend()
plt.show()
Output:
2. Custom Legend Position
You can specify the location of the legend by providing a string or an integer to the loc parameter. Some common values for the loc parameter include ‘upper right’, ‘lower left’, ‘center’, ‘upper center’, and ‘lower center’.
import matplotlib.pyplot as plt

x = [1, 2, 3, 4, 5]
y = [1, 4, 9, 16, 25]

plt.plot(x, y, label='y = x^2')
plt.legend(loc='upper left')
plt.show()
Output:

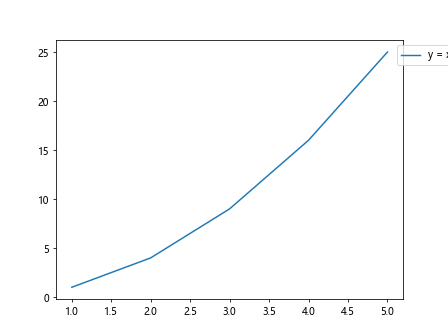
3. Absolute Legend Position
If you want to specify the exact position of the legend within the plot, you can use the bbox_to_anchor parameter. This parameter takes a tuple of two values, where the first value represents the x-coordinate and the second value represents the y-coordinate.
import matplotlib.pyplot as plt

x = [1, 2, 3, 4, 5]
y = [1, 4, 9, 16, 25]

plt.plot(x, y, label='y = x^2')
plt.legend(loc='upper right', bbox_to_anchor=(1.2, 1))
plt.show()
Output:
4. Legend Outside the Plot
To place the legend outside the plot area, you can combine the loc and bbox_to_anchor parameters. This will allow you to position the legend relative to the plot’s bounding box.
import matplotlib.pyplot as plt

x = [1, 2, 3, 4, 5]
y = [1, 4, 9, 16, 25]

plt.plot(x, y, label='y = x^2')
plt.legend(loc='upper left', bbox_to_anchor=(1, 1))
plt.show()
Output:

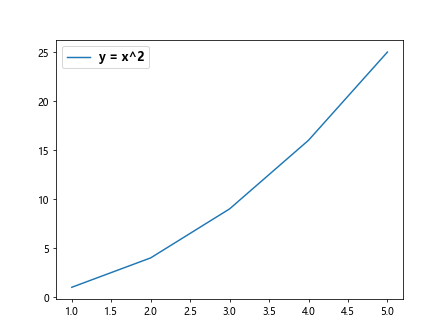
5. Adjusting Legend Size
You can adjust the size of the legend using the prop parameter, which accepts a dictionary of font properties. This allows you to customize the font size, style, and weight of the legend text.
import matplotlib.pyplot as plt

x = [1, 2, 3, 4, 5]
y = [1, 4, 9, 16, 25]

plt.plot(x, y, label='y = x^2')
plt.legend(prop={'size': 12, 'weight': 'bold'})
plt.show()
Output:
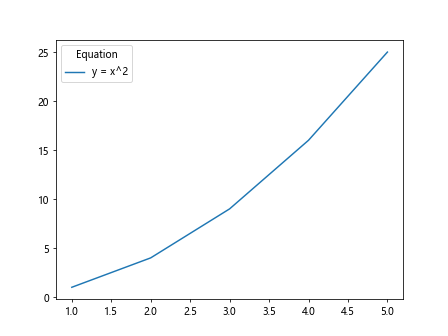
6. Legend Title
Matplotlib allows you to add a title to the legend using the title parameter. This can be useful for providing additional context or information about the items in the legend.
import matplotlib.pyplot as plt

x = [1, 2, 3, 4, 5]
y = [1, 4, 9, 16, 25]

plt.plot(x, y, label='y = x^2')
plt.legend(title='Equation')
plt.show()
Output:
7. Legend Border
You can customize the border around the legend using the fancybox parameter. Setting fancybox=True will create a rounded border, while setting fancybox=False will create a standard rectangular border.
import matplotlib.pyplot as plt

x = [1, 2, 3, 4, 5]
y = [1, 4, 9, 16, 25]

plt.plot(x, y, label='y = x^2')
plt.legend(fancybox=True)
plt.show()
Output:

8. Legend Background Color
To change the background color of the legend, you can use the facecolor parameter. This allows you to make the legend stand out from the rest of the plot.
import matplotlib.pyplot as plt

x = [1, 2, 3, 4, 5]
y = [1, 4, 9, 16, 25]

plt.plot(x, y, label='y = x^2')
plt.legend(facecolor='lightgrey')
plt.show()
Output:

9. Legend Border Color
In addition to changing the background color, you can also customize the border color of the legend using the edgecolor parameter. This can help to further highlight the legend within the plot.
import matplotlib.pyplot as plt

x = [1, 2, 3, 4, 5]
y = [1, 4, 9, 16, 25]

plt.plot(x, y, label='y = x^2')
plt.legend(edgecolor='black')
plt.show()
Output:

10. Legend Transparency
To make the legend partially transparent, you can adjust the alpha parameter. This allows you to control the opacity of the legend while still maintaining visibility.
import matplotlib.pyplot as plt

x = [1, 2, 3, 4, 5]
y = [1, 4, 9, 16, 25]

plt.plot(x, y, label='y = x^2')
plt.legend(alpha=0.8)
plt.show()
11. Legend Shadow
You can add a shadow effect to the legend by setting the shadow parameter to True. This can create a visually appealing 3D effect for the legend.
import matplotlib.pyplot as plt

x = [1, 2, 3, 4, 5]
y = [1, 4, 9, 16, 25]

plt.plot(x, y, label='y = x^2')
plt.legend(shadow=True)
plt.show()
Output:
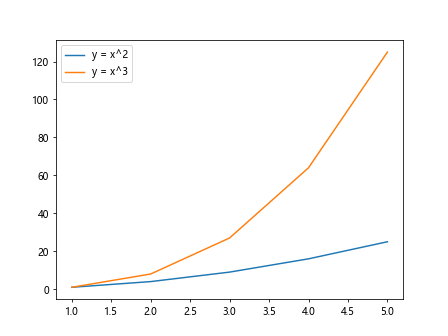
12. Multiple Legends
If you have multiple elements in a plot and want to create separate legends for each, you can use the label parameter in each plot command and call the legend() function multiple times.
import matplotlib.pyplot as plt

x = [1, 2, 3, 4, 5]
y = [1, 4, 9, 16, 25]

plt.plot(x, y, label='y = x^2')
plt.plot(x, [i**3 for i in x], label='y = x^3')
plt.legend()
plt.show()
Output:
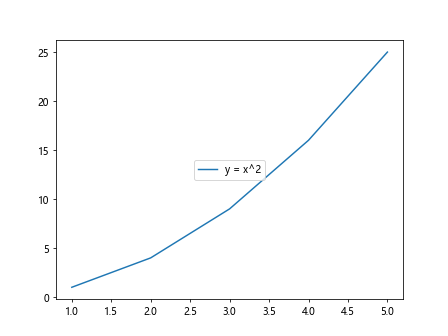
13. Legend Position Using Keywords
Matplotlib also provides a convenient way to specify the legend position using keywords, such as ‘upper right’, ‘lower left’, ‘center’, ‘upper center’, and ‘lower center’.
import matplotlib.pyplot as plt

x = [1, 2, 3, 4, 5]
y = [1, 4, 9, 16, 25]

plt.plot(x, y, label='y = x^2')
plt.legend(loc='center')
plt.show()
Output:
14. Legend Alignment
You can align the legend text using the align parameter. This allows you to specify whether the text should be left-aligned, right-aligned, or centered within the legend box.
import matplotlib.pyplot as plt

x = [1, 2, 3, 4, 5]
y = [1, 4, 9, 16, 25]

plt.plot(x, y, label='y = x^2')
plt.legend(align='right')
plt.show()
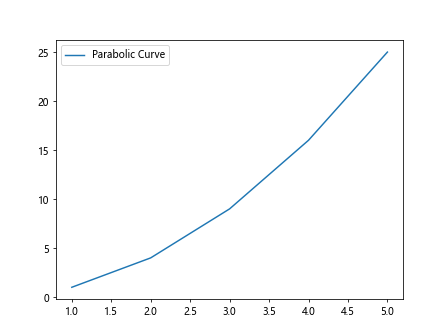
15. Custom Legend Labels
If you want to customize the labels in the legend, you can provide a list of strings to the labels parameter. This allows you to create descriptive and informative labels for each item in the legend.
import matplotlib.pyplot as plt

x = [1, 2, 3, 4, 5]
y = [1, 4, 9, 16, 25]

plt.plot(x, y, label='y = x^2')
plt.legend(labels=['Parabolic Curve'])
plt.show()
Output:
16. Legend Title Font Properties
You can adjust the font properties of the legend title separately from the rest of the text using the title_fontsize, title_fontweight, and title_fontstyle parameters.
import matplotlib.pyplot as plt

x = [1, 2, 3, 4, 5]
y = [1, 4, 9, 16, 25]

plt.plot(x, y, label='y = x^2')
plt.legend(title='Equation', title_fontsize=14, title_fontweight='bold', title_fontstyle='italic')
plt.show()
17. Legend Label Font Properties
Similarly, you can customize the font properties of the legend labels using the label_fontsize, label_fontweight, and label_fontstyle parameters.
import matplotlib.pyplot as plt

x = [1, 2, 3, 4, 5]
y = [1, 4, 9, 16, 25]

plt.plot(x, y, label='y = x^2')
plt.legend(label_fontsize=12, label_fontweight='bold', label_fontstyle='italic')
plt.show()
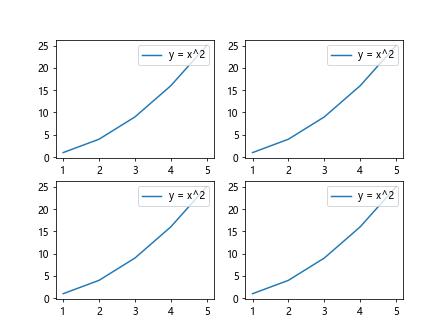
18. Legend Placement in Subplots
When working with subplots, you can adjust the position of the legend within each subplot by specifying the bbox_to_anchor parameter for each subplot individually.
import matplotlib.pyplot as plt

x = [1, 2, 3, 4, 5]
y = [1, 4, 9, 16, 25]

fig, ax = plt.subplots(2, 2)

for i in range(4):
    ax[i//2, i%2].plot(x, y, label='y = x^2')
    ax[i//2, i%2].legend(loc='upper right', bbox_to_anchor=(1, 1))

plt.show()
Output:
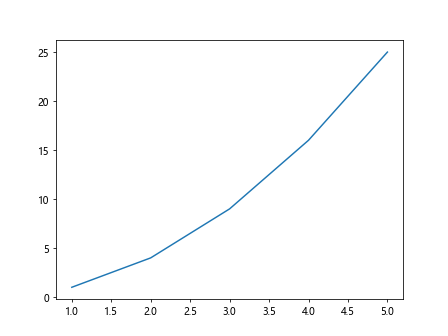
19. Removing the Legend
If you want to remove the legend from a plot, you can simply omit the label parameter when plotting the data.
import matplotlib.pyplot as plt

x = [1, 2, 3, 4, 5]
y = [1, 4, 9, 16, 25]

plt.plot(x, y)
plt.show()
Output:
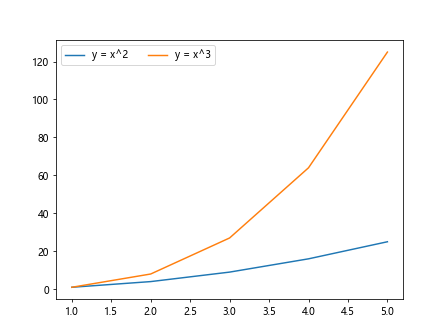
20. Legend with Multiple Columns
To display the legend items in multiple columns, you can use the ncol parameter. This allows you to create a more compact and organized legend layout.
import matplotlib.pyplot as plt

x = [1, 2, 3, 4, 5]
y = [1, 4, 9, 16, 25]

plt.plot(x, y, label='y = x^2')
plt.plot(x, [i**3 for i in x], label='y = x^3')
plt.legend(ncol=2)
plt.show()
Output:
In this article, we have covered various ways to adjust the position and appearance of the legend in Matplotlib plots. By customizing the legend properties, you can make your plots more informative and visually appealing. Experiment with the different parameters and techniques to find the best configuration for your specific plot.