How to Label a Point in Matplotlib
Matplotlib is a popular Python library for creating static, animated, and interactive visualizations. One common task when creating plots is labeling specific points or data points to provide additional information to the viewer. In this article, we will explore how to label a point in Matplotlib using various methods and techniques.
Method 1: Annotating a Point with Text
One of the most straightforward ways to label a point in Matplotlib is by annotating it with text. This method allows you to add custom text near a specific data point on the plot. Here is an example of how to annotate a point in Matplotlib:
import matplotlib.pyplot as plt

# Create some data points
x = [1, 2, 3, 4, 5]
y = [2, 3, 5, 7, 11]

plt.scatter(x, y)

# Annotate a specific point with text
plt.annotate('Point here', (3, 5), textcoords="offset points", xytext=(10,-10), ha='center')

plt.show()
Output:
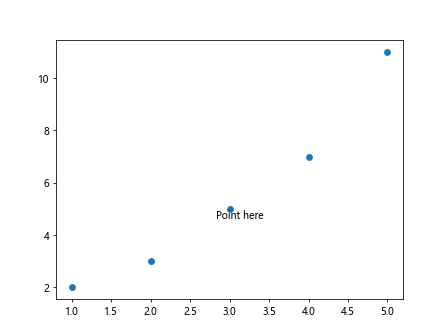
In this code snippet, we use the annotate function to add the text ‘Point here’ near the data point at coordinates (3, 5). The textcoords parameter specifies the coordinate system of the text we are adding, while xytext adjusts the offset of the text with respect to the annotated point.
Method 2: Using Arrow Annotations
Another way to label a point in Matplotlib is by using arrow annotations. Arrow annotations are useful when you want to draw attention to a specific point on the plot with an arrow pointing to it. Here is an example of how to use arrow annotations in Matplotlib:
import matplotlib.pyplot as plt

# Create some data points
x = [1, 2, 3, 4, 5]
y = [2, 3, 5, 7, 11]

plt.scatter(x, y)

# Annotate a specific point with an arrow
plt.annotate('Point here', (3, 5), xytext=(5, 10), textcoords='offset points', arrowprops=dict(arrowstyle='->'))

plt.show()
Output:
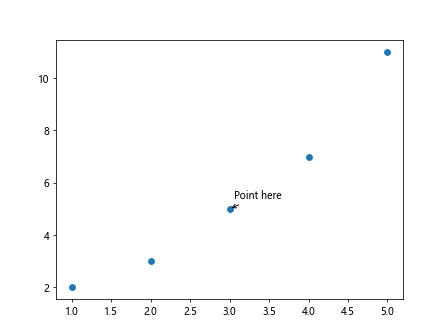
In this code snippet, we use the annotate function with the arrowprops parameter to include an arrow pointing to the annotated text ‘Point here’ near the data point at coordinates (3, 5).
Method 3: Creating a Custom Text Box
If you want more control over the appearance of the label, you can create a custom text box to label a point in Matplotlib. This method allows you to customize the text box with different colors, borders, and font styles. Here is an example of how to create a custom text box in Matplotlib:
import matplotlib.pyplot as plt
from matplotlib.patches import FancyBboxPatch

# Create some data points
x = [1, 2, 3, 4, 5]
y = [2, 3, 5, 7, 11]

plt.scatter(x, y)

# Create a custom text box
bbox_props = dict(boxstyle="round,pad=0.3", fc="cyan", ec="b", lw=2)
t = plt.text(3, 5, "Point here", ha='center', va='center',
             fontsize=12, bbox=bbox_props)

plt.show()
Output:
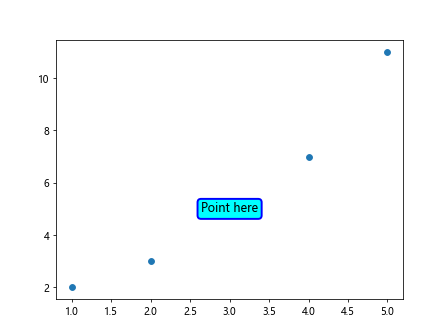
In this code snippet, we use the FancyBboxPatch class from matplotlib.patches to create a custom text box with a rounded shape, cyan fill color, blue border color, and padding of 0.3. The text function then adds the text ‘Point here’ inside the custom text box at coordinates (3, 5).
Method 4: Adding Labels to Specific Data Points
Sometimes, you may want to label specific data points on a plot with their corresponding values. Matplotlib provides a convenient way to achieve this using the annotate function along with looping through the data points. Here is an example of how to add labels to specific data points in Matplotlib:
import matplotlib.pyplot as plt

# Create some data points
x = [1, 2, 3, 4, 5]
y = [2, 3, 5, 7, 11]

plt.scatter(x, y)

# Label specific data points with their values
for i, txt in enumerate(y):
    plt.annotate(txt, (x[i], y[i]), textcoords="offset points", xytext=(0,10), ha='center')

plt.show()
Output:
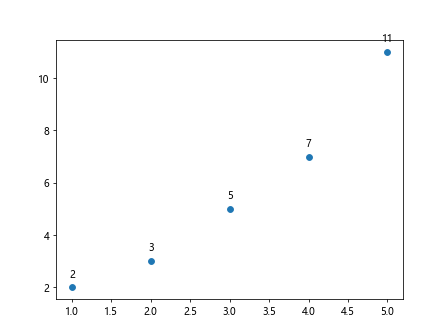
In this code snippet, we loop through the data points and use the enumerate function to access both the index and value of each data point. We then annotate each data point with its corresponding value at an offset position above the point.
Method 5: Highlighting a Specific Point
To draw attention to a specific point on a plot, you can highlight it by changing its marker style, size, or color. This method helps distinguish the labeled point from other data points on the plot. Here is an example of how to highlight a specific point in Matplotlib:
import matplotlib.pyplot as plt

# Create some data points
x = [1, 2, 3, 4, 5]
y = [2, 3, 5, 7, 11]

plt.scatter(x, y)

# Highlight a specific data point
plt.scatter(3, 5, c='red', s=100, marker='o')

plt.show()
Output:
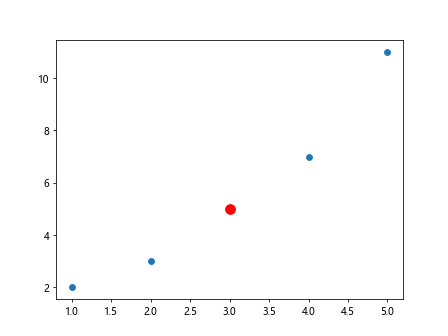
In this code snippet, we use the scatter function to create a red circle marker with a size of 100 at the data point (3, 5), effectively highlighting this specific point on the plot.
Method 6: Labeling Points in a 3D Plot
When working with 3D plots in Matplotlib, the process of labeling points is slightly different than in 2D plots. You can use the annotate3d function from the mpl_toolkits.mplot3d module to add text annotations to specific data points in a 3D plot. Here is an example of how to label points in a 3D plot using Matplotlib:
import matplotlib.pyplot as plt
from mpl_toolkits.mplot3d import Axes3D

# Create some 3D data points
x = [1, 2, 3, 4, 5]
y = [2, 3, 5, 7, 11]
z = [1, 3, 2, 4, 5]

fig = plt.figure()
ax = fig.add_subplot(111, projection='3d')

# Plot 3D data points
ax.scatter(x, y, z)

# Annotate a specific 3D point with text
ax.text(3, 5, 2, "Point here", color='red')

plt.show()
Output:
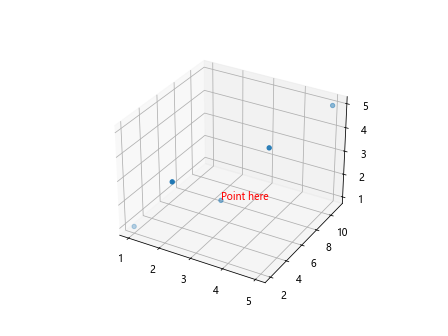
In this code snippet, we first create a 3D plot using the Axes3D class from mpl_toolkits.mplot3d. We then use the text function to add the text ‘Point here’ to the data point at coordinates (3, 5, 2) in the 3D plot.
Method 7: Using Legend to Label Points
Another way to label points in a plot is by using a legend. This method is useful when you want to distinguish between different groups of data or data with specific properties. You can use the legend function in Matplotlib to create a legend with labels for each data point group. Here is an example of how to use a legend to label points in Matplotlib:
import matplotlib.pyplot as plt

# Create some data points for two groups
x1 = [1, 2, 3, 4, 5]
y1 = [2, 3, 5, 7, 11]
x2 = [1, 2, 3, 4, 5]
y2 = [1, 4, 6, 8, 10]

plt.scatter(x1, y1, label='Group 1')
plt.scatter(x2, y2, label='Group 2')
plt.legend()

plt.show()
Output:
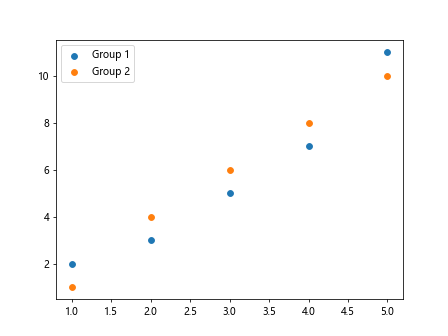
In this code snippet, we have two groups of data points represented by different markers. We use the scatter function to plot the data points for each group and add labels ‘Group 1’ and ‘Group 2’ tothe legend using the label parameter. The legend function is then called to display the legend on the plot.
Method 8: Using Colorbar to Label Points
If you are working with a color-mapped plot in Matplotlib, you can use a colorbar to label specific data points based on their color values. This method is particularly useful for showing the relationship between data points and their corresponding color values. Here is an example of how to use a colorbar to label points in Matplotlib:
import matplotlib.pyplot as plt
import numpy as np

# Create some data points with corresponding colors
x = [1, 2, 3, 4, 5]
y = [2, 3, 5, 7, 11]
colors = np.array([1, 2, 3, 4, 5])

plt.scatter(x, y, c=colors, cmap='viridis')
plt.colorbar(label='Color Value')

plt.show()
Output:
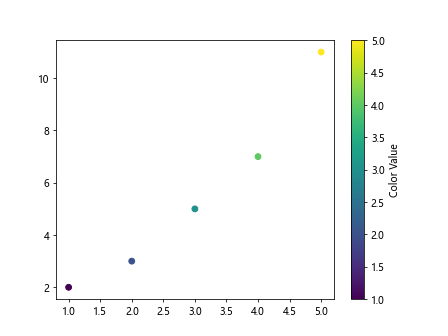
In this code snippet, we use a color-mapped scatter plot with the c parameter set to the array colors. The colorbar function is then called with the label ‘Color Value’ to create a colorbar that labels the data points based on their color values.
Method 9: Labeling Points on a Polar Plot
In Matplotlib, you can create polar plots using the polar function from the Axes class. When labeling data points on a polar plot, you can use radial and angular coordinates to position the labels. Here is an example of how to label points on a polar plot in Matplotlib:
import matplotlib.pyplot as plt
import numpy as np

# Generate some polar data points
theta = np.linspace(0, 2*np.pi, 100)
r = np.abs(np.sin(3*theta))

plt.polar(theta, r)

# Label a specific data point with text
plt.text(np.pi/4, np.sin(3*np.pi/4), 'Point here', fontsize=12, color='red')

plt.show()
Output:
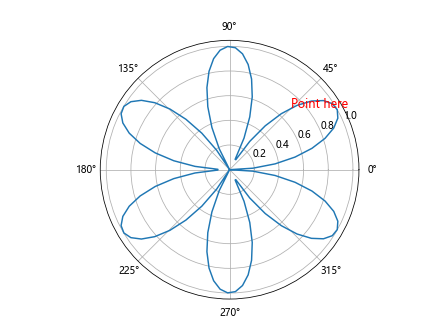
In this code snippet, we create a polar plot using the polar function and plot some polar data points. We then use the text function to add the text ‘Point here’ to a specific data point at an angular position of np.pi/4 and a radial position of np.sin(3*np.pi/4).
Method 10: Interactive Labeling Using Widgets
For more interactive data visualization and labeling, you can use widgets in Matplotlib. Widgets allow the user to interact with the plot and label specific data points dynamically. Here is an example of how to use widgets for interactive labeling in Matplotlib:
import matplotlib.pyplot as plt
import numpy as np
from ipywidgets import interact

x = np.linspace(-10, 10, 100)
y = x ** 2

plt.plot(x, y)
plt.title('Interactive Labeling')

def label_point(x, y, label):
    plt.scatter(x, y, color='red')
    plt.text(x, y, label, fontsize=12, color='blue', ha='right')

interact(label_point, x=(-10, 10), y=(0, 100), label='Point here')

plt.show()
In this code snippet, we create an interactive plot using the interact function from the ipywidgets module. The label_point function is called when the user interacts with the plot, adding a red marker and blue text label to the specified data point.
Conclusion
In this article, we have explored various methods and techniques for labeling points in Matplotlib plots. From annotating points with text to using legends, colorbars, and interactive widgets, there are multiple ways to add labels to specific data points on a plot. By choosing the appropriate method based on your plotting requirements, you can effectively communicate information and highlight important data points in your visualizations. Experiment with these labeling techniques in Matplotlib to enhance the clarity and interpretability of your plots.