Matplotlib fmt errorbar
When plotting data in Matplotlib, it is often useful to include error bars to visualize uncertainty in the data. Error bars can be added to plots using the errorbar function in Matplotlib. In this article, we will explore how to use the fmt parameter in the errorbar function to customize the appearance of the error bars.
Basic Errorbar Plot
To start, let’s create a basic errorbar plot using the errorbar function. In this example, we will plot some random data points with error bars.
import matplotlib.pyplot as plt
import numpy as np
x = np.arange(0, 10, 1)
y = np.random.rand(10)
errors = np.random.rand(10)
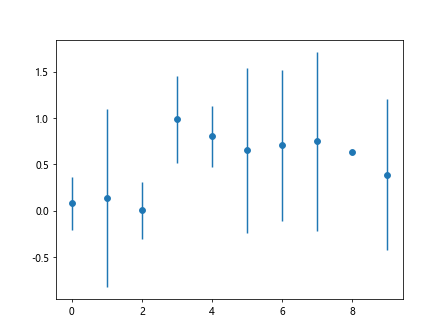
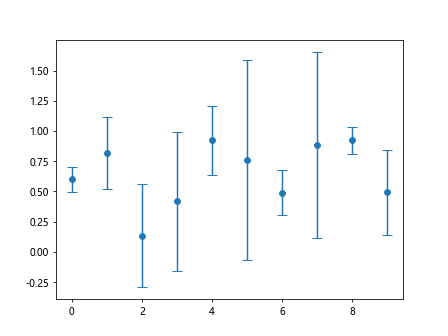
plt.errorbar(x, y, yerr=errors, fmt='o')
plt.show()
Output:
In the code snippet above, we create an array x representing the x-values, an array y representing the y-values, and an array errors representing the error values. We then use the errorbar function to plot the data points with error bars (yerr=errors) and specify the marker style using the fmt='o' parameter.
Customizing Error Bar Format
The fmt parameter in the errorbar function allows us to customize the appearance of the error bars by specifying a combination of line styles, markers, and colors. Here are some examples of how we can use the fmt parameter to customize the error bars:
Example 1: Solid Line with Circle Markers
import matplotlib.pyplot as plt
import numpy as np

x = np.arange(0, 10, 1)
y = np.random.rand(10)
errors = np.random.rand(10)

plt.errorbar(x, y, yerr=errors, fmt='-o')
plt.show()
Output:
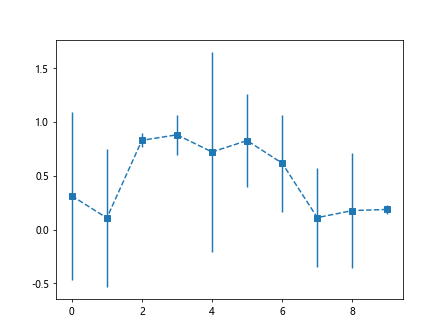
Example 2: Dashed Line with Square Markers
import matplotlib.pyplot as plt
import numpy as np

x = np.arange(0, 10, 1)
y = np.random.rand(10)
errors = np.random.rand(10)

plt.errorbar(x, y, yerr=errors, fmt='--s')
plt.show()
Output:
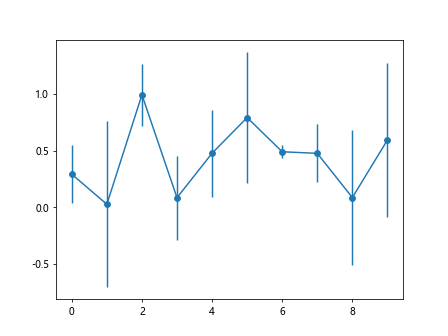
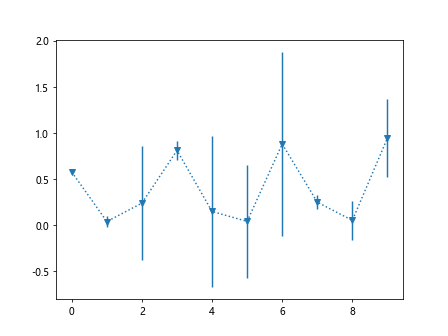
Example 3: Dotted Line with Triangle Markers
import matplotlib.pyplot as plt
import numpy as np

x = np.arange(0, 10, 1)
y = np.random.rand(10)
errors = np.random.rand(10)

plt.errorbar(x, y, yerr=errors, fmt=':v')
plt.show()
Output:
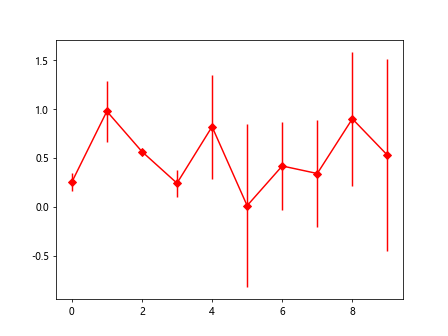
Example 4: Red Error Bars with Diamond Markers
import matplotlib.pyplot as plt
import numpy as np

x = np.arange(0, 10, 1)
y = np.random.rand(10)
errors = np.random.rand(10)

plt.errorbar(x, y, yerr=errors, fmt='r-D')
plt.show()
Output:
Combining Format Options
We can combine multiple format options in the fmt parameter to create custom error bar styles. Here are some examples of combining format options:
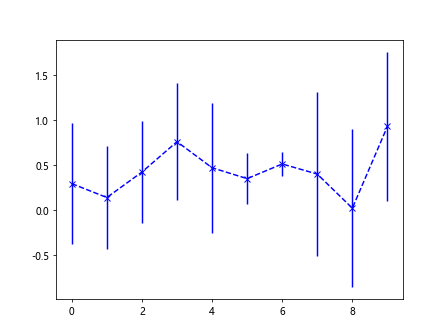
Example 5: Blue Dashed Line with Cross Markers
import matplotlib.pyplot as plt
import numpy as np

x = np.arange(0, 10, 1)
y = np.random.rand(10)
errors = np.random.rand(10)

plt.errorbar(x, y, yerr=errors, fmt='b--x')
plt.show()
Output:
Example 6: Green Dotted Line with Plus Markers
import matplotlib.pyplot as plt
import numpy as np

x = np.arange(0, 10, 1)
y = np.random.rand(10)
errors = np.random.rand(10)

plt.errorbar(x, y, yerr=errors, fmt='g:.+')
plt.show()
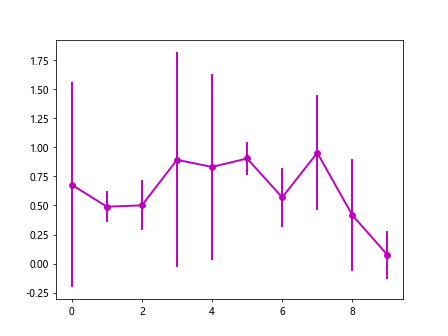
Example 7: Magenta Solid Line with Circle Markers and Thick Line
import matplotlib.pyplot as plt
import numpy as np

x = np.arange(0, 10, 1)
y = np.random.rand(10)
errors = np.random.rand(10)

plt.errorbar(x, y, yerr=errors, fmt='m-o', linewidth=2)
plt.show()
Output:
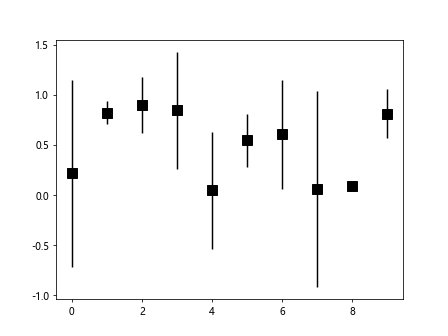
Example 8: Black Error Bars with Square Markers and Marker Size 10
import matplotlib.pyplot as plt
import numpy as np

x = np.arange(0, 10, 1)
y = np.random.rand(10)
errors = np.random.rand(10)

plt.errorbar(x, y, yerr=errors, fmt='ks', markersize=10)
plt.show()
Output:
Adding Error Bar Caps
In addition to customizing the format of the error bars, we can also add caps to the error bars using the capsize parameter in the errorbar function. Here’s an example of adding caps to the error bars:
import matplotlib.pyplot as plt
import numpy as np

x = np.arange(0, 10, 1)
y = np.random.rand(10)
errors = np.random.rand(10)

plt.errorbar(x, y, yerr=errors, fmt='o', capsize=5)
plt.show()
Output:
In the code snippet above, we specify capsize=5 to add caps of length 5 to the error bars.
Conclusion
In this article, we have explored how to use the fmt parameter in the errorbar function in Matplotlib to customize the appearance of error bars in plots. By specifying different combinations of line styles, markers, and colors, we can create visually appealing error bar plots that effectively communicate the uncertainty in the data. Experiment with the examples provided and try different format options to create error bar plots that suit your specific visualization needs.