How to Add a Legend in Matplotlib
When creating plots using Matplotlib, it is often necessary to include a legend to provide context for the data being displayed. A legend is a key that explains the meaning of the data in the plot. In this article, we will explore how to add a legend to plots created in Matplotlib using various methods and customization options.
Method 1: Adding a Basic Legend
To add a basic legend to a plot in Matplotlib, you can use the plt.legend() function. This function takes a list of labels as an argument, which correspond to the elements in the plot that you want to include in the legend.
import matplotlib.pyplot as plt

x = [1, 2, 3, 4, 5]
y1 = [2, 4, 6, 8, 10]
y2 = [1, 3, 5, 7, 9]

plt.plot(x, y1, label='Line 1')
plt.plot(x, y2, label='Line 2')
plt.legend()
plt.show()
Output:
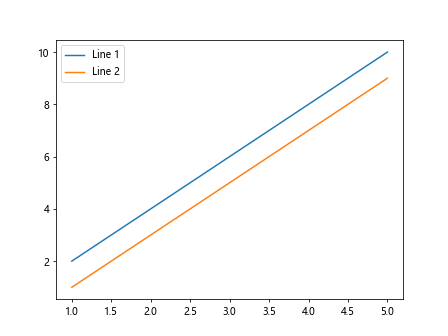
In this example, we have two lines plotted on the same graph, and the legend displays the labels ‘Line 1’ and ‘Line 2’ next to each line.
Method 2: Customizing the Legend
Matplotlib provides several customization options for the appearance of the legend. You can change the location, font size, border, background color, and other properties of the legend.
import matplotlib.pyplot as plt

x = [1, 2, 3, 4, 5]
y1 = [2, 4, 6, 8, 10]
y2 = [1, 3, 5, 7, 9]

plt.plot(x, y1, label='Line 1')
plt.plot(x, y2, label='Line 2')
plt.legend(loc='upper right', fontsize='large', frameon=True, facecolor='lightgray')
plt.show()
Output:
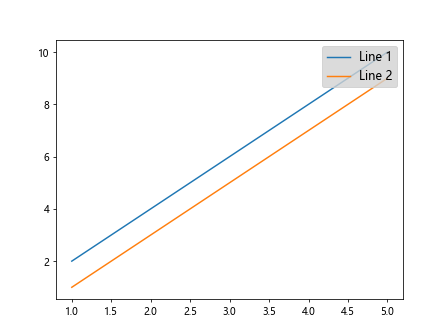
In this example, we have changed the location of the legend to the upper right corner, increased the font size to ‘large’, enabled the legend frame, and set the background color to ‘lightgray’.
Method 3: Adding a Title to the Legend
You can also add a title to the legend in Matplotlib using the title keyword argument in the plt.legend() function.
import matplotlib.pyplot as plt

x = [1, 2, 3, 4, 5]
y1 = [2, 4, 6, 8, 10]
y2 = [1, 3, 5, 7, 9]

plt.plot(x, y1, label='Line 1')
plt.plot(x, y2, label='Line 2')
plt.legend(title='Legend Title')
plt.show()
Output:
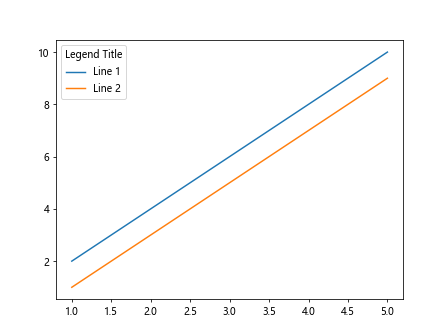
In this example, the legend includes a title “Legend Title” above the labels ‘Line 1’ and ‘Line 2’.
Method 4: Handling Multiple Legends
If you have multiple elements in your plot and want to create separate legends for each group of elements, you can use the plt.legend() function multiple times with different subsets of labels.
import matplotlib.pyplot as plt

x = [1, 2, 3, 4, 5]
y1 = [2, 4, 6, 8, 10]
y2 = [1, 3, 5, 7, 9]

x = [1, 2, 3, 4, 5]
y1 = [2, 4, 6, 8, 10]
y2 = [1, 3, 5, 7, 9]

plt.plot(x, y1, label='Line 1')
plt.plot(x, y2, label='Line 2')
plt.legend(['Line 1'], loc='upper left')
plt.legend(['Line 2'], loc='upper right')
plt.show()
Output:
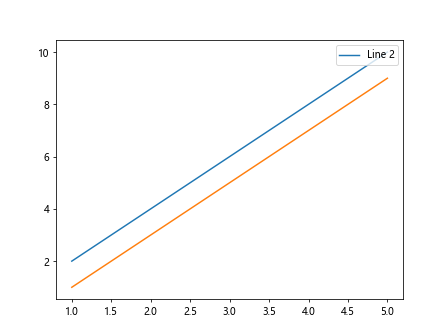
In this example, we have two separate legends for ‘Line 1’ and ‘Line 2’, each positioned in different corners of the plot.
Method 5: Creating a Legend with Custom Labels
If you want to create a legend with custom labels that are different from the plot labels, you can pass a list of custom labels to the labels keyword argument in the plt.legend() function.
import matplotlib.pyplot as plt

x = [1, 2, 3, 4, 5]
y1 = [2, 4, 6, 8, 10]
y2 = [1, 3, 5, 7, 9]

plt.plot(x, y1)
plt.plot(x, y2)
plt.legend(['Label A', 'Label B'])
plt.show()
Output:
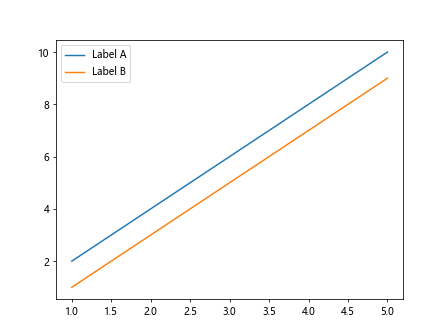
In this example, the legend displays the custom labels ‘Label A’ and ‘Label B’ instead of the default labels ‘Line 1’ and ‘Line 2’.
Method 6: Adding a Legend to a Scatter Plot
You can also add a legend to scatter plots in Matplotlib by passing a label argument to the plt.scatter() function.
import numpy as np
import matplotlib.pyplot as plt

y1 = [2, 4, 6, 8, 10]
y2 = [1, 3, 5, 7, 9]

x = np.random.rand(50)
y = np.random.rand(50)
sizes = np.random.randint(10, 100, size=50)

plt.scatter(x, y, s=sizes, label='Data Points')
plt.legend()
plt.show()
Output:
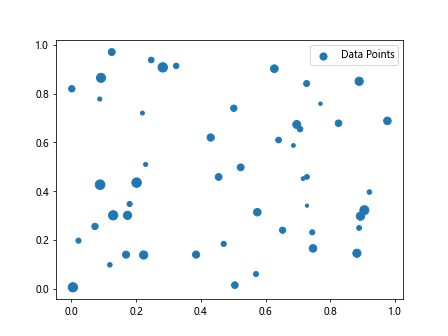
In this example, we have a scatter plot with custom point sizes, and the legend displays the label ‘Data Points’.
Method 7: Adding a Legend to a Bar Chart
To add a legend to a bar chart in Matplotlib, you can pass a list of labels to the plt.bar() function and then call the plt.legend() function.
import matplotlib.pyplot as plt

x = [1, 2, 3, 4, 5]
y1 = [2, 4, 6, 8, 10]
y2 = [1, 3, 5, 7, 9]

categories = ['A', 'B', 'C', 'D']
values = [10, 20, 15, 25]

plt.bar(categories, values, label='Bar Chart')
plt.legend()
plt.show()
Output:
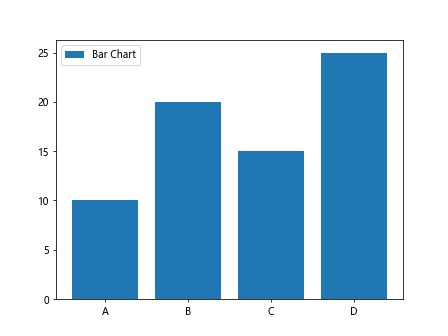
In this example, the legend displays the label ‘Bar Chart’ for the bar chart.
Method 8: Adding a Legend to a Pie Chart
Adding a legend to a pie chart in Matplotlib is similar to other types of plots. You can pass a list of labels to the plt.pie() function and then call the plt.legend() function.
import matplotlib.pyplot as plt

x = [1, 2, 3, 4, 5]
y1 = [2, 4, 6, 8, 10]
y2 = [1, 3, 5, 7, 9]

labels = ['A', 'B', 'C', 'D']
sizes = [25, 35, 20, 20]

plt.pie(sizes, labels=labels)
plt.legend()
plt.show()
Output:
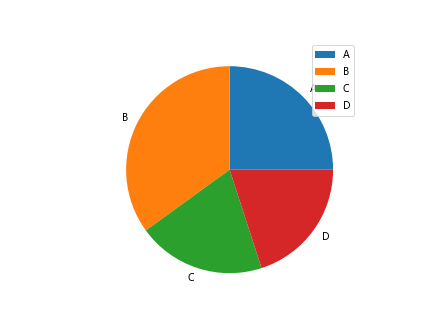
In this example, the legend displays the labels ‘A’, ‘B’, ‘C’, and ‘D’ corresponding to the sections of the pie chart.
Method 9: Customizing Legend Labels
You can customize the labels in the legend by using the handles and labels arguments in the plt.legend() function. This allows you to control the appearance and order of the legend labels.
import matplotlib.pyplot as plt

x = [1, 2, 3, 4, 5]
y1 = [2, 4, 6, 8, 10]
y2 = [1, 3, 5, 7, 9]

line1, = plt.plot(x, y1)
line2, = plt.plot(x, y2)

plt.legend(handles=[line1, line2], labels=['Custom Label 1', 'Custom Label 2'])
plt.show()
Output:
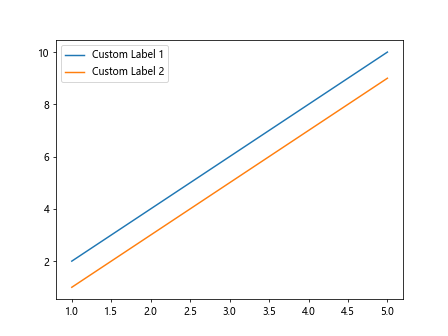
In this example, we have specified custom labels ‘Custom Label 1’ and ‘Custom Label 2’ for the corresponding lines in the legend.
Method 10: Adding a Legend Title
To add a title to the legend in Matplotlib, you can use the plt.gca().get_legend() function to access the legend object and set its properties, such as the title.
import matplotlib.pyplot as plt

x = [1, 2, 3, 4, 5]
y1 = [2, 4, 6, 8, 10]
y2 = [1, 3, 5, 7, 9]

plt.plot(x, y1, label='Line 1')
plt.plot(x, y2, label='Line 2')

legend = plt.gca().get_legend()
legend.set_title('Legend Title')
plt.show()
In this example, we set the title of the legend to ‘Legend Title’ using the set_title() method on the legend object.
Conclusion
In this article, we have explored various methods for adding a legend to plots in Matplotlib. We have covered basic legend creation, customization options, handling multiple legends, creating legends with custom labels, and adding legends to different types of plots such as scatter plots, bar charts, and pie charts. By following these examples and customization options, you can enhance the visual representation of your data in Matplotlib plots.