Subplots Title
Subplots are a useful feature in Matplotlib that allow you to create multiple plots within a single figure. This can be particularly useful when comparing different datasets or visualizing multiple aspects of the same data. In this article, we will focus on how to add titles to individual subplots in Matplotlib.
Adding a Title to a Single Subplot
To add a title to a single subplot in Matplotlib, you can use the set_title() method on the Axes object. Here is an example of how you can add a title to a single subplot:
import matplotlib.pyplot as plt

fig, ax = plt.subplots()
ax.plot([1, 2, 3, 4], [1, 4, 9, 16])
ax.set_title('Subplot Title')
plt.show()
Output:
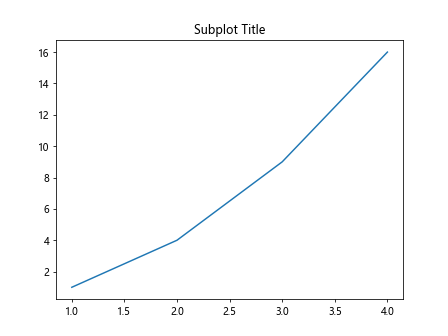
In this example, we create a single subplot using plt.subplots() and plot a simple line graph. We then use set_title() to add a title to the subplot.
Adding Titles to Multiple Subplots
If you have multiple subplots in a figure and want to add titles to each of them, you can iterate over the Axes objects and use set_title() for each subplot. Here is an example:
import matplotlib.pyplot as plt

fig, axs = plt.subplots(2)
for i, ax in enumerate(axs):
    ax.plot([1, 2, 3, 4], [1, 4, 9, 16])
    ax.set_title(f'Subplot {i+1} Title')
plt.show()
Output:
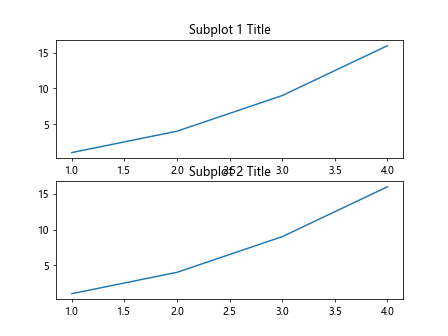
In this example, we create two subplots using plt.subplots(2) and plot a simple line graph in each subplot. We then iterate over the Axes objects using a for loop and add titles to each subplot.
Customizing Subplot Titles
You can customize the appearance of subplot titles by passing additional parameters to the set_title() method. Here are some common parameters you can use to customize subplot titles:
fontsize: The font size of the title.fontweight: The font weight of the title (e.g., ‘bold’, ‘normal’).color: The color of the title text.pad: The distance between the title and the top of the subplot.
Here is an example that demonstrates how to customize the titles of multiple subplots:
import matplotlib.pyplot as plt

fig, axs = plt.subplots(2)
for i, ax in enumerate(axs):
    ax.plot([1, 2, 3, 4], [1, 4, 9, 16])
    ax.set_title(f'Subplot {i+1} Title', fontsize=14, fontweight='bold', color='green', pad=15)
plt.show()
Output:
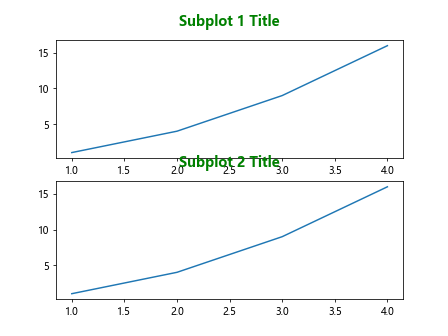
In this example, we customize the titles of the subplots by setting the font size to 14, font weight to ‘bold’, color to ‘green’, and pad to 15.
Rotating Subplot Titles
If you have long subplot titles and want to rotate them for better readability, you can use the rotation parameter in the set_title() method. Here is an example that demonstrates how to rotate subplot titles:
import matplotlib.pyplot as plt

fig, axs = plt.subplots(2)
for i, ax in enumerate(axs):
    ax.plot([1, 2, 3, 4], [1, 4, 9, 16])
    ax.set_title(f'Long Subplot Title {i+1}', rotation=45)
plt.show()
Output:
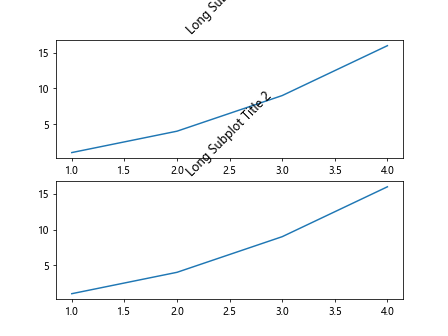
In this example, we create two subplots with long titles and rotate the titles by 45 degrees using the rotation parameter.
Adding a Figure Title
In addition to adding titles to individual subplots, you can also add a title to the entire figure using the suptitle() method. Here is an example that demonstrates how to add a title to a figure:
import matplotlib.pyplot as plt

fig, axs = plt.subplots(2)
for i, ax in enumerate(axs):
    ax.plot([1, 2, 3, 4], [1, 4, 9, 16])
    ax.set_title(f'Subplot {i+1} Title')

fig.suptitle('Figure Title')
plt.show()
Output:
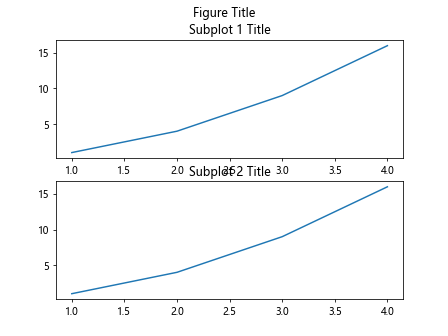
In this example, we add a title to the entire figure using the suptitle() method. The figure title appears at the top of the figure above the subplots.
Conclusion
In this article, we have covered how to add titles to individual subplots in Matplotlib. We have seen how to add titles to single subplots, multiple subplots, customize subplot titles, rotate subplot titles, and add a title to the entire figure. Titles are an important aspect of data visualization as they provide context and information to the viewer. By effectively using titles in your plots, you can enhance the clarity and readability of your visualizations.