How to Add Minor Ticks in Matplotlib
Matplotlib is a powerful Python library for creating visualizations. One common requirement when plotting data is to include minor ticks on the axes. Minor ticks provide additional granularity to the plot, making it easier to interpret the data. In this article, we will explore how to add minor ticks to plots using Matplotlib.
1. Adding Minor Ticks to the X-axis
To add minor ticks to the x-axis in Matplotlib, you can use the AutoMinorLocator class from the matplotlib.ticker module. Here is an example code snippet:
import matplotlib.pyplot as plt
import numpy as np
from matplotlib.ticker import AutoMinorLocator

x = np.linspace(0, 10, 100)
y = np.sin(x)

fig, ax = plt.subplots()
ax.plot(x, y)

minor_locator = AutoMinorLocator(4)
ax.xaxis.set_minor_locator(minor_locator)

plt.show()
Output:
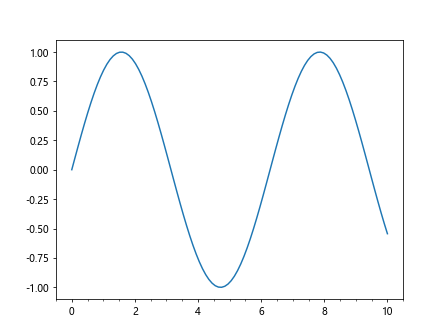
In this example, we create a plot of the sine function and add minor ticks to the x-axis using the AutoMinorLocator class with a step size of 4.
2. Adding Minor Ticks to the Y-axis
Adding minor ticks to the y-axis in Matplotlib is similar to adding them to the x-axis. You can use the AutoMinorLocator class from the matplotlib.ticker module. Here is an example code snippet:
import matplotlib.pyplot as plt
import numpy as np
from matplotlib.ticker import AutoMinorLocator

x = np.linspace(0, 10, 100)
y = np.sin(x)

fig, ax = plt.subplots()
ax.plot(x, y)

minor_locator = AutoMinorLocator(5)
ax.yaxis.set_minor_locator(minor_locator)

plt.show()
Output:
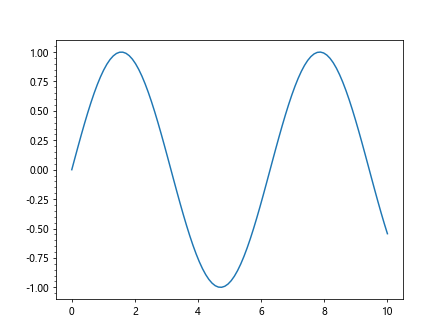
In this example, we create a plot of the sine function and add minor ticks to the y-axis using the AutoMinorLocator class with a step size of 5.
3. Customizing Minor Ticks
You can customize the appearance of minor ticks in Matplotlib by setting various properties such as color, size, and style. Here is an example code snippet that demonstrates how to customize minor ticks:
import matplotlib.pyplot as plt
import numpy as np
from matplotlib.ticker import AutoMinorLocator

x = np.linspace(0, 10, 100)
y = np.sin(x)

fig, ax = plt.subplots()
ax.plot(x, y)

minor_locator = AutoMinorLocator(4)
ax.xaxis.set_minor_locator(minor_locator)

ax.tick_params(which='minor', length=4, color='r')

plt.show()
Output:
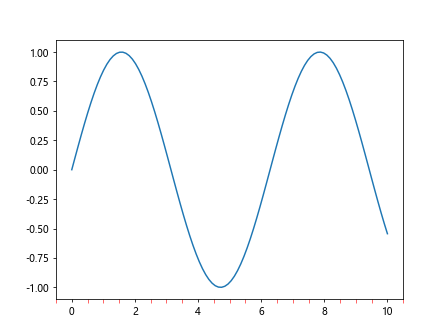
In this example, we set the length of the minor ticks to 4 and the color to red on the x-axis.
4. Adding Minor Ticks to a Logarithmic Scale
You can also add minor ticks to a plot with a logarithmic scale in Matplotlib. Here is an example code snippet that demonstrates adding minor ticks to a log scale plot:
import matplotlib.pyplot as plt
import numpy as np
from matplotlib.ticker import LogLocator

x = np.linspace(1, 10, 100)
y = np.exp(x)

fig, ax = plt.subplots()
ax.semilogy(x, y)

minor_locator = LogLocator(subs=np.arange(2, 10) * 0.1)
ax.yaxis.set_minor_locator(minor_locator)

plt.show()
Output:
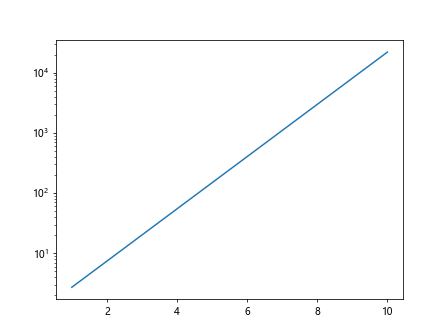
In this example, we create a plot with a logarithmic y-axis and add minor ticks using the LogLocator class with a custom set of subsampling values.
5. Multi-axis Plots with Minor Ticks
When creating plots with multiple axes in Matplotlib, you may want to add minor ticks to each axis. Here is an example code snippet that demonstrates adding minor ticks to both the x-axis and y-axis of a subplot:
import matplotlib.pyplot as plt
import numpy as np
from matplotlib.ticker import AutoMinorLocator

x = np.linspace(0, 10, 100)
y1 = np.sin(x)
y2 = np.cos(x)

fig, (ax1, ax2) = plt.subplots(2, 1)
ax1.plot(x, y1)
ax2.plot(x, y2)

for ax in [ax1, ax2]:
    minor_locator = AutoMinorLocator(4)
    ax.xaxis.set_minor_locator(minor_locator)
    ax.yaxis.set_minor_locator(minor_locator)

plt.show()
Output:
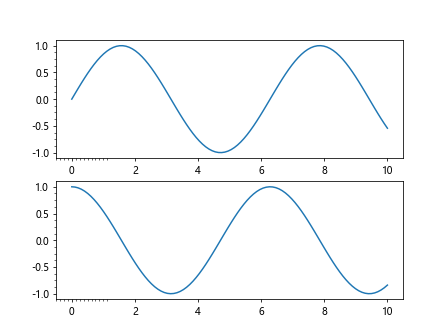
In this example, we create a subplot with two axes and add minor ticks to both the x and y-axes of each subplot.
6. Adding Custom Minor Ticks
You can also add custom minor ticks to a plot in Matplotlib by specifying the positions of the ticks. Here is an example code snippet that demonstrates how to add custom minor ticks:
import matplotlib.pyplot as plt
import numpy as np
from matplotlib.ticker import FixedLocator

x = np.linspace(0, 10, 100)
y = np.sin(x)

fig, ax = plt.subplots()
ax.plot(x, y)

minor_ticks = [1, 2, 3, 4, 5, 6, 7, 8, 9]
minor_locator = FixedLocator(minor_ticks)
ax.xaxis.set_minor_locator(minor_locator)

plt.show()
Output:
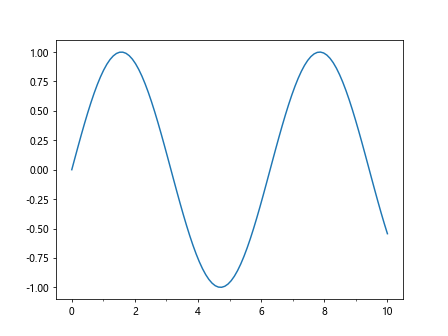
In this example, we create a plot of the sine function and add custom minor ticks at specified positions on the x-axis.
7. Adding Minor Ticks to a Bar Plot
You can add minor ticks to a bar plot in Matplotlib to enhance the visualization of the data. Here is an example code snippet that demonstrates adding minor ticks to a bar plot:
import matplotlib.pyplot as plt

categories = ['A', 'B', 'C', 'D', 'E']
values = [10, 20, 15, 30, 25]

fig, ax = plt.subplots()
ax.bar(categories, values)

ax.xaxis.set_minor_locator(plt.MultipleLocator(0.5))

plt.show()
Output:
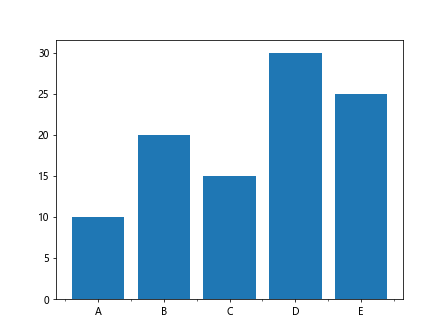
In this example, we create a bar plot with five categories and add minor ticks with a step size of 0.5 to the x-axis.
8. Adding Minor Ticks to a Scatter Plot
You can also add minor ticks to a scatter plot in Matplotlib to improve the readability of the plot. Here is an example code snippet that demonstrates adding minor ticks to a scatter plot:
import matplotlib.pyplot as plt
import numpy as np

x = np.random.randn(100)
y = np.random.randn(100)

plt.scatter(x, y)
plt.minorticks_on()
plt.show()
Output:
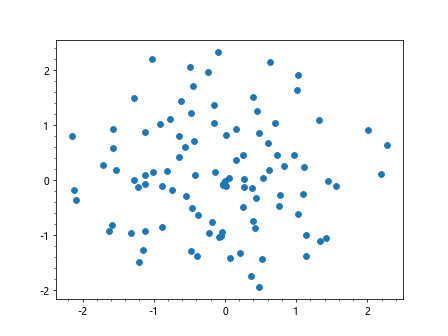
In this example, we create a scatter plot of randomly generated data and enable minor ticks on both axes using the minorticks_on() function.
9. Adding Minor Ticks to a Contour Plot
When creating a contour plot in Matplotlib, you may want to add minor ticks to improve the readability of the plot. Here is an example code snippet that demonstrates adding minor ticks to a contour plot:
import matplotlib.pyplot as plt
import numpy as np

x = np.linspace(-2, 2, 100)
y = np.linspace(-2, 2, 100)
X, Y = np.meshgrid(x, y)
Z = np.sin(X) * np.cos(Y)

plt.contourf(X, Y, Z)
plt.minorticks_on()
plt.show()
Output:
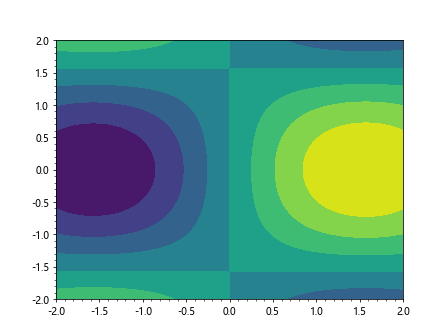
In this example, we create a contour plot of the sine of X multiplied by the cosine of Y and enable minor ticks on both axes using the minorticks_on() function.
10. Adding Minor Ticks to a 3D Plot
You can also add minor ticks to a 3D plot in Matplotlib to enhance the visualization of the data. Here is an example code snippet that demonstrates adding minor ticks to a 3D plot:
import matplotlib.pyplot as plt
import numpy as np
from mpl_toolkits.mplot3d import Axes3D

x = np.linspace(-5, 5, 100)
y = np.linspace(-5, 5, 100)
X, Y = np.meshgrid(x, y)
Z = np.sin(np.sqrt(X**2 + Y**2))

fig = plt.figure()
ax = fig.add_subplot(111, projection='3d')
ax.plot_surface(X, Y, Z)

ax.minorticks_on()

plt.show()
Output:
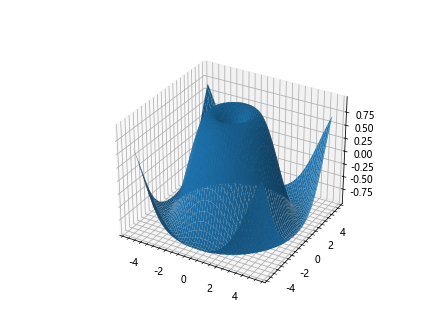
In this example, we create a 3D surface plot of the sine of the square root of the sum of X squared and Ysquared and enable minor ticks using the minorticks_on() function.
11. Adjusting the Frequency of Minor Ticks
You can adjust the frequency of minor ticks on the axes in Matplotlib by setting the linestyle parameter of the AutoMinorLocator class. Here is an example code snippet that demonstrates adjusting the frequency of minor ticks:
import matplotlib.pyplot as plt
import numpy as np
from matplotlib.ticker import AutoMinorLocator

x = np.linspace(0, 10, 100)
y = np.sin(x)

fig, ax = plt.subplots()
ax.plot(x, y)

minor_locator = AutoMinorLocator(n=5)
minor_locator.set_params(linestyle='--')
ax.xaxis.set_minor_locator(minor_locator)

plt.show()
In this example, we create a plot of the sine function and adjust the frequency of minor ticks on the x-axis by setting the linestyle parameter of the AutoMinorLocator class to ‘–‘.
12. Adding Minor Ticks to a Polar Plot
You can add minor ticks to a polar plot in Matplotlib to improve the readability of the plot. Here is an example code snippet that demonstrates adding minor ticks to a polar plot:
import matplotlib.pyplot as plt
import numpy as np

theta = np.linspace(0, 2*np.pi, 100)
r = np.abs(np.sin(2*theta))

plt.polar(theta, r)
plt.minorticks_on()
plt.show()
Output:
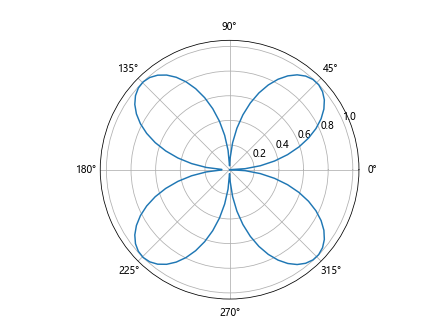
In this example, we create a polar plot of the absolute value of the sine of 2 times theta and enable minor ticks on the polar axis using the minorticks_on() function.
13. Adding Minor Ticks with Logarithmic Scaling
When working with logarithmic scaling in Matplotlib, you can add minor ticks to improve the visualization of the data. Here is an example code snippet that demonstrates adding minor ticks with logarithmic scaling:
import matplotlib.pyplot as plt
import numpy as np
from matplotlib.ticker import LogLocator

x = np.linspace(1, 10, 100)
y = np.exp(x)

fig, ax = plt.subplots()
ax.semilogy(x, y)

minor_locator = LogLocator(subs=np.arange(10, 100, 10))
minor_locator.set_params(numdecs=4)
ax.yaxis.set_minor_locator(minor_locator)

plt.show()
In this example, we create a plot with a logarithmic y-axis using the semilogy() function and add minor ticks with a custom set of subsampling values using the LogLocator class.
14. Adding Minor Ticks to a Box Plot
You can add minor ticks to a box plot in Matplotlib to enhance the visualization of the data. Here is an example code snippet that demonstrates adding minor ticks to a box plot:
import matplotlib.pyplot as plt
import numpy as np

data = np.random.normal(0, 1, 100)
plt.boxplot(data)
plt.minorticks_on()
plt.show()
Output:
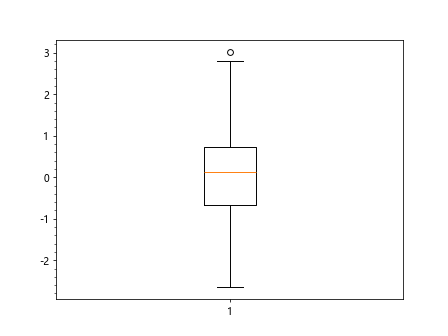
In this example, we create a box plot of randomly generated data and enable minor ticks on the y-axis using the minorticks_on() function.
15. Adding Minor Ticks to a Histogram
You can also add minor ticks to a histogram in Matplotlib to improve the readability of the plot. Here is an example code snippet that demonstrates adding minor ticks to a histogram:
import matplotlib.pyplot as plt
import numpy as np

data = np.random.normal(0, 1, 100)
plt.hist(data, bins=10)
plt.minorticks_on()
plt.show()
Output:
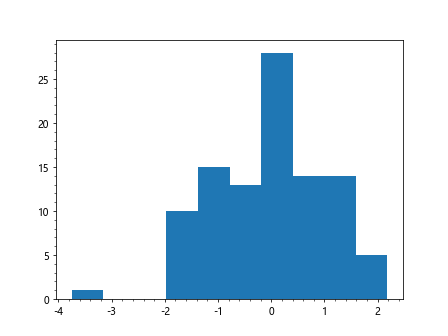
In this example, we create a histogram of randomly generated data with 10 bins and enable minor ticks on the y-axis using the minorticks_on() function.
16. Adding Minor Ticks to a Pie Chart
You can add minor ticks to a pie chart in Matplotlib to enhance the visualization of the data. Here is an example code snippet that demonstrates adding minor ticks to a pie chart:
import matplotlib.pyplot as plt

sizes = [15, 30, 45, 10]
labels = ['A', 'B', 'C', 'D']

plt.pie(sizes, labels=labels, autopct='%1.1f%%')
plt.minorticks_on()
plt.show()
Output:
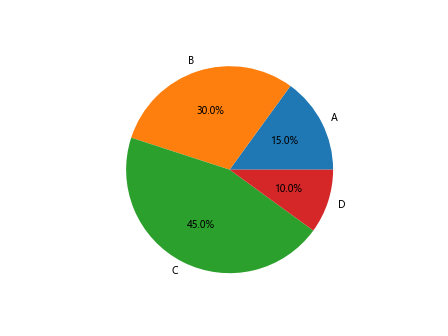
In this example, we create a pie chart with four slices and enable minor ticks on the polar axis using the minorticks_on() function.
17. Adding Custom Minor Ticks to a Plot
You can add custom minor ticks to a plot in Matplotlib by specifying the positions of the ticks. Here is an example code snippet that demonstrates how to add custom minor ticks:
import matplotlib.pyplot as plt
import numpy as np
from matplotlib.ticker import FixedLocator

x = np.linspace(0, 10, 100)
y = np.sin(x)

fig, ax = plt.subplots()
ax.plot(x, y)

minor_ticks = [2.5, 5.0, 7.5]
minor_locator = FixedLocator(minor_ticks)
ax.xaxis.set_minor_locator(minor_locator)

plt.show()
Output:
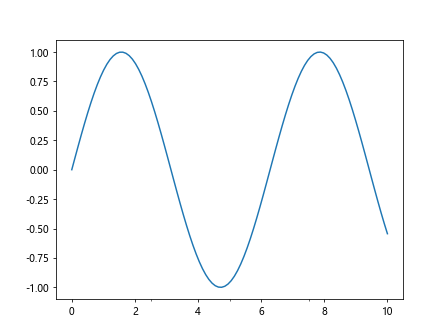
In this example, we create a plot of the sine function and add custom minor ticks at specified positions on the x-axis.
18. Adding Minor Ticks to a Heatmap Plot
You can add minor ticks to a heatmap plot in Matplotlib to improve the readability of the plot. Here is an example code snippet that demonstrates adding minor ticks to a heatmap plot:
import matplotlib.pyplot as plt
import numpy as np

data = np.random.rand(10, 10)
plt.imshow(data, cmap='hot')
plt.colorbar()
plt.minorticks_on()
plt.show()
Output:
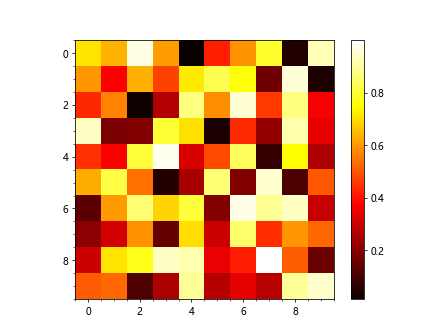
In this example, we create a heatmap plot of randomly generated data and enable minor ticks on both axes using the minorticks_on() function.
19. Adding Minor Ticks to a Violin Plot
You can add minor ticks to a violin plot in Matplotlib to enhance the visualization of the data. Here is an example code snippet that demonstrates adding minor ticks to a violin plot:
import matplotlib.pyplot as plt
import numpy as np

data = [np.random.normal(0, 1, 100), np.random.normal(1, 1, 100)]
plt.violinplot(data)
plt.minorticks_on()
plt.show()
Output:
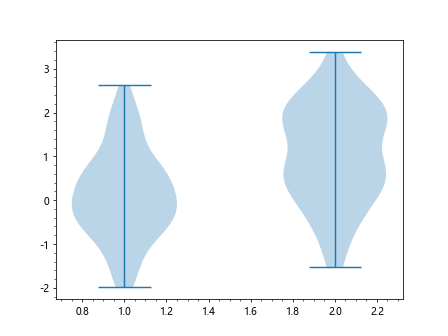
In this example, we create a violin plot of two sets of randomly generated data and enable minor ticks on the y-axis using the minorticks_on() function.
20. Adding Minor Ticks to a Stem Plot
You can also add minor ticks to a stem plot in Matplotlib to improve the readability of the plot. Here is an example code snippet that demonstrates adding minor ticks to a stem plot:
import matplotlib.pyplot as plt
import numpy as np

x = np.linspace(0, 10, 100)
y = np.sin(x)

plt.stem(x, y)
plt.minorticks_on()
plt.show()
Output:
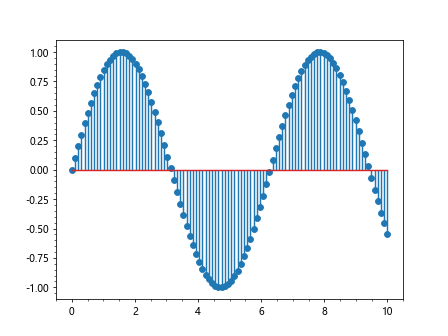
In this example, we create a stem plot of the sine function and enable minor ticks on the x-axis using the minorticks_on() function.
Conclusion
In this article, we have explored how to add minor ticks to plots in Matplotlib. We have covered various scenarios, including adding minor ticks to different types of plots, customizing minor ticks, adjusting the frequency of minor ticks, and working with logarithmic scaling. By incorporating minor ticks into your plots, you can enhance the visualization of your data and communicate your findings more effectively. Experiment with the examples provided in this article to create visually appealing plots with minor ticks using Matplotlib.