Adding Titles in Matplotlib
When creating visualizations using Matplotlib, it is important to add titles to your plots to provide context and help the audience understand the data being displayed. In this article, we will explore different ways to add titles in Matplotlib plots.
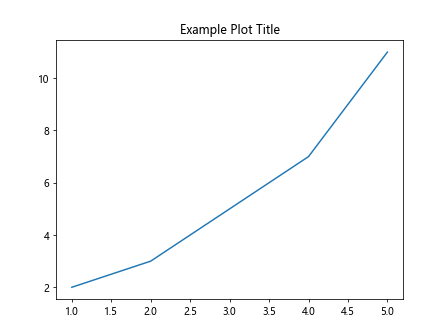
1. Adding a Title to a Basic Plot
You can add a title to a basic Matplotlib plot by using the plt.title() function. Here’s an example:
import matplotlib.pyplot as plt

x = [1, 2, 3, 4, 5]
y = [2, 3, 5, 7, 11]

plt.plot(x, y)
plt.title('Example Plot Title')
plt.show()
Output:
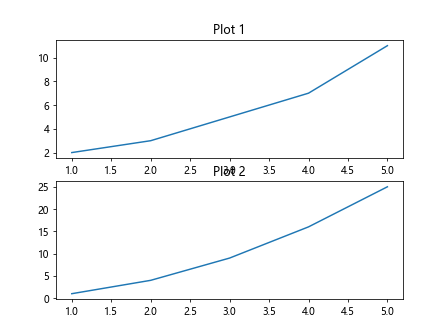
2. Adding Titles to Subplots
When working with subplots in Matplotlib, you can add titles to individual subplots using the set_title() method. Here’s an example:
import matplotlib.pyplot as plt

fig, axs = plt.subplots(2)

x1 = [1, 2, 3, 4, 5]
y1 = [2, 3, 5, 7, 11]

x2 = [1, 2, 3, 4, 5]
y2 = [1, 4, 9, 16, 25]

axs[0].plot(x1, y1)
axs[0].set_title('Plot 1')

axs[1].plot(x2, y2)
axs[1].set_title('Plot 2')

plt.show()
Output:
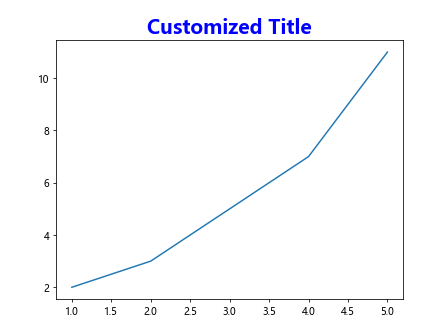
3. Customizing Title Appearance
You can customize the appearance of the title in Matplotlib by setting various parameters such as font size, font weight, and font color. Here’s an example:
import matplotlib.pyplot as plt

x = [1, 2, 3, 4, 5]
y = [2, 3, 5, 7, 11]

plt.plot(x, y)
plt.title('Customized Title', fontsize=20, fontweight='bold', color='blue')
plt.show()
Output:
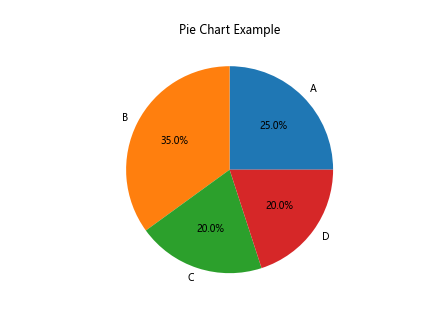
4. Adding a Title to a Pie Chart
When creating a pie chart in Matplotlib, you can add a title using the plt.title() function. Here’s an example:
import matplotlib.pyplot as plt

labels = ['A', 'B', 'C', 'D']
sizes = [25, 35, 20, 20]

plt.pie(sizes, labels=labels, autopct='%1.1f%%')
plt.title('Pie Chart Example')
plt.show()
Output:
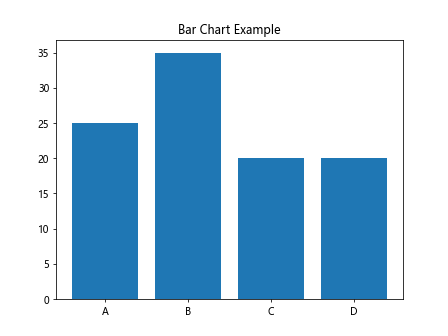
5. Adding a Title to a Bar Chart
You can add a title to a bar chart in Matplotlib using the plt.title() function. Here’s an example:
import matplotlib.pyplot as plt

x = ['A', 'B', 'C', 'D']
y = [25, 35, 20, 20]

plt.bar(x, y)
plt.title('Bar Chart Example')
plt.show()
Output:
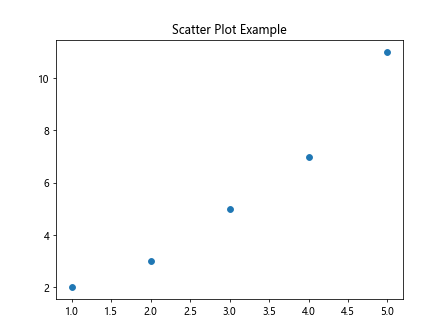
6. Adding a Title to a Scatter Plot
In a scatter plot, you can add a title using the plt.title() function. Here’s an example:
import matplotlib.pyplot as plt

x = [1, 2, 3, 4, 5]
y = [2, 3, 5, 7, 11]

plt.scatter(x, y)
plt.title('Scatter Plot Example')
plt.show()
Output:
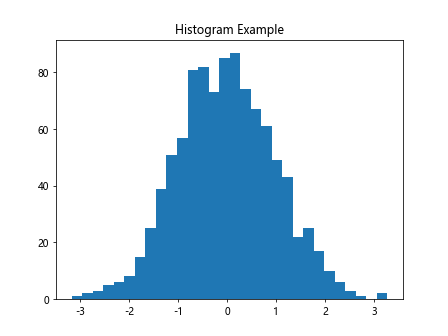
7. Adding a Title to a Histogram
You can add a title to a histogram in Matplotlib using the plt.title() function. Here’s an example:
import matplotlib.pyplot as plt
import numpy as np

data = np.random.randn(1000)

plt.hist(data, bins=30)
plt.title('Histogram Example')
plt.show()
Output:
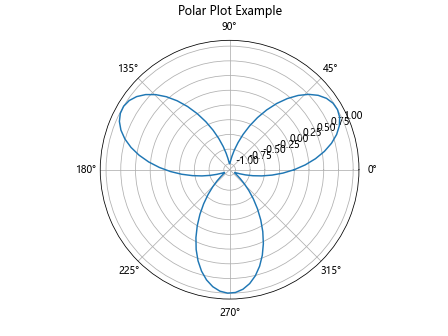
8. Adding Title to Polar Plot
In a polar plot, you can add a title using the plt.title() function. Here’s an example:
import matplotlib.pyplot as plt
import numpy as np

theta = np.linspace(0, 2*np.pi, 100)
r = np.sin(3*theta)

plt.polar(theta, r)
plt.title('Polar Plot Example')
plt.show()
Output:
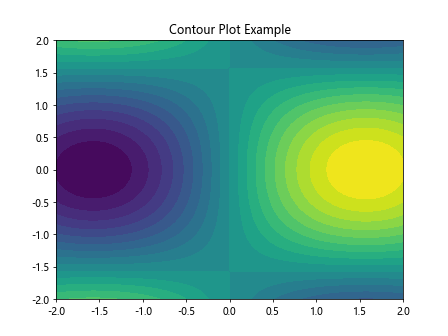
9. Adding a Title to a Contour Plot
When creating a contour plot, you can add a title using the plt.title() function. Here’s an example:
import matplotlib.pyplot as plt
import numpy as np

x = np.linspace(-2, 2, 100)
y = np.linspace(-2, 2, 100)
X, Y = np.meshgrid(x, y)
Z = np.sin(X) * np.cos(Y)

plt.contourf(X, Y, Z, levels=20)
plt.title('Contour Plot Example')
plt.show()
Output:
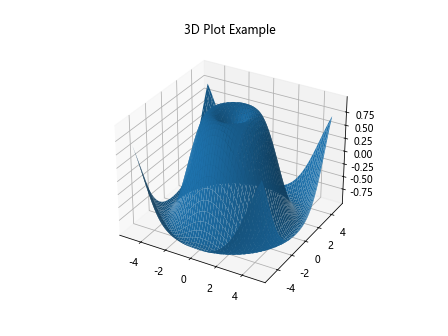
10. Adding a Title to a 3D Plot
In a 3D plot, you can add a title using the plt.title() function. Here’s an example:
import matplotlib.pyplot as plt
from mpl_toolkits.mplot3d import Axes3D
import numpy as np

fig = plt.figure()
ax = fig.add_subplot(111, projection='3d')

x = np.linspace(-5, 5, 100)
y = np.linspace(-5, 5, 100)
X, Y = np.meshgrid(x, y)
Z = np.sin(np.sqrt(X**2 + Y**2))

ax.plot_surface(X, Y, Z)
plt.title('3D Plot Example')
plt.show()
Output:
Conclusion
In this article, we have covered various ways to add titles in different types of Matplotlib plots. Titles are an essential component of any visualization as they provide valuable information about the data being presented. Experiment with the examples provided to create visually appealing plots with informative titles.