How to Adjust Figure Size in Matplotlib
Matplotlib is a powerful visualization library in Python that allows users to create high-quality plots and figures. One common task when working with Matplotlib is adjusting the size of the figure to better fit the data or improve the presentation of the plot. In this guide, we will explore various methods to adjust the figure size in Matplotlib.
Set Figure Size Using figure(figsize)
One way to adjust the figure size in Matplotlib is by using the figure(figsize) method. This method allows you to specify the width and height of the figure in inches.
import matplotlib.pyplot as plt

# Create a figure with a specified size
plt.figure(figsize=(10, 6))

# Plot a simple line chart
plt.plot([1, 2, 3, 4, 5], [1, 4, 9, 16, 25])

plt.show()
Output:

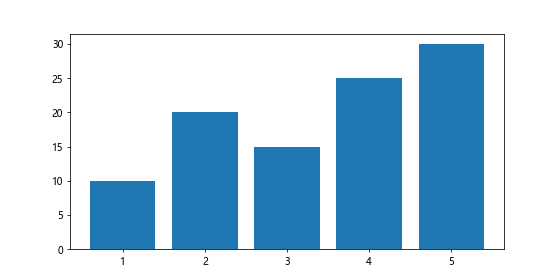
Set Figure Size Using set_figwidth and set_figheight
Another way to adjust the figure size is by setting the figure width and height after creating the figure object using the set_figwidth and set_figheight methods.
import matplotlib.pyplot as plt

# Create a figure
fig = plt.figure()

# Set the figure width and height
fig.set_figwidth(8)
fig.set_figheight(4)

# Plot a simple bar chart
plt.bar([1, 2, 3, 4, 5], [10, 20, 15, 25, 30])

plt.show()
Output:
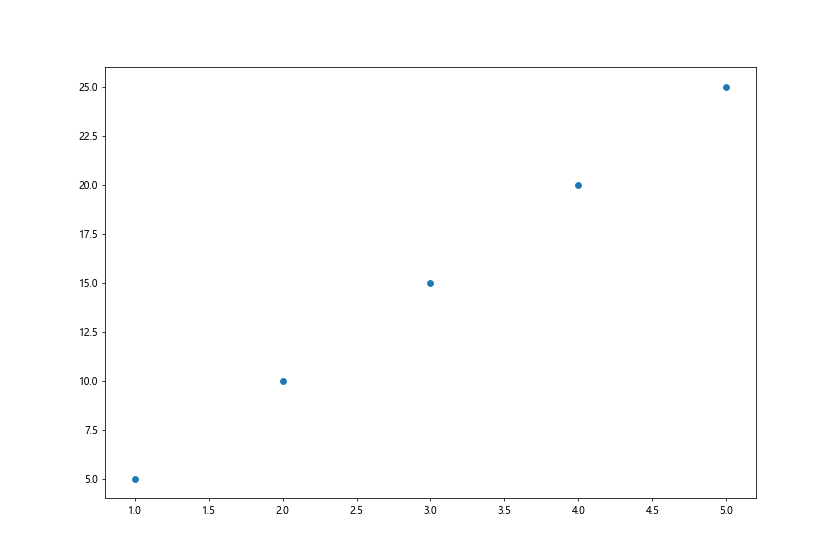
Set Figure Size Using set_size_inches
You can also adjust the figure size using the set_size_inches method, which allows you to specify the width and height of the figure in inches.
import matplotlib.pyplot as plt

# Create a figure
fig = plt.figure()

# Set the figure size in inches
fig.set_size_inches(12, 8)

# Plot a scatter plot
plt.scatter([1, 2, 3, 4, 5], [5, 10, 15, 20, 25])

plt.show()
Output:
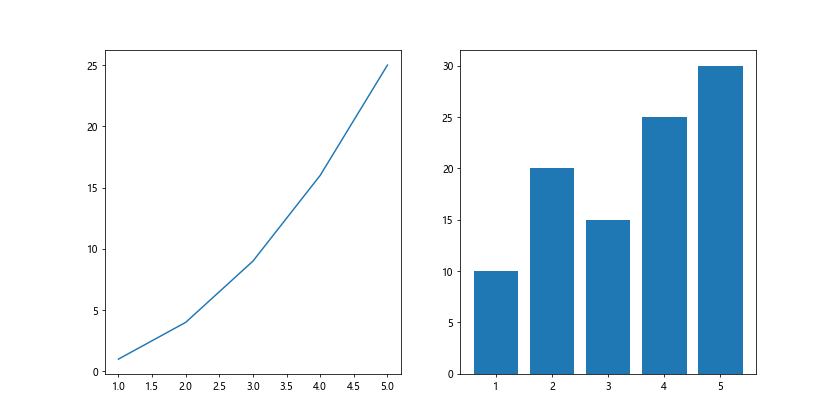
Adjust Figure Size in Subplots
When creating subplots in Matplotlib, you can adjust the figure size for each subplot individually.
import matplotlib.pyplot as plt

# Create a figure with two subplots
fig, axs = plt.subplots(1, 2, figsize=(12, 6))

# Plot on the first subplot
axs[0].plot([1, 2, 3, 4, 5], [1, 4, 9, 16, 25])

# Plot on the second subplot
axs[1].bar([1, 2, 3, 4, 5], [10, 20, 15, 25, 30])

plt.show()
Output:
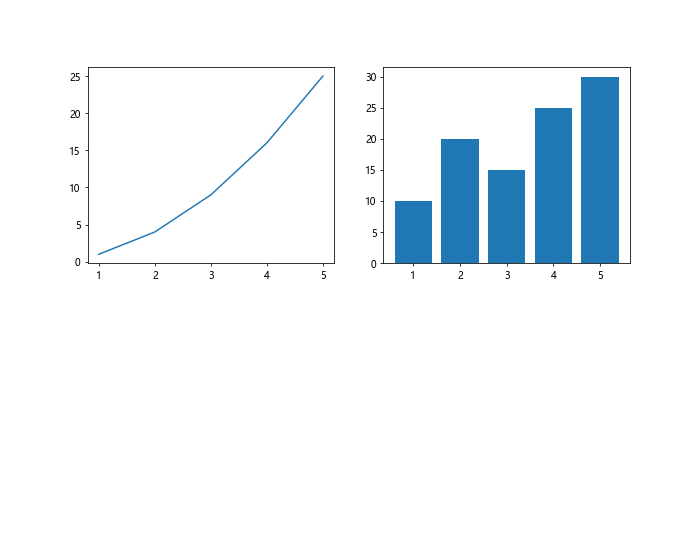
Adjust Figure Size in Different Layouts
You can adjust the figure size in Matplotlib for different layouts, such as gridspec layout.
import matplotlib.pyplot as plt
import matplotlib.gridspec as gridspec

# Create a figure with gridspec layout
fig = plt.figure(figsize=(10, 8))

# Use gridspec to define the layout
gs = gridspec.GridSpec(2, 2)

# Plot on the first subplot
ax1 = fig.add_subplot(gs[0, 0])
ax1.plot([1, 2, 3, 4, 5], [1, 4, 9, 16, 25])

# Plot on the second subplot
ax2 = fig.add_subplot(gs[0, 1])
ax2.bar([1, 2, 3, 4, 5], [10, 20, 15, 25, 30])

plt.show()
Output:
Adjust Figure Size for Specific Plots
You can adjust the figure size for specific types of plots in Matplotlib, such as histograms.
import matplotlib.pyplot as plt

# Create a figure with a specified size
plt.figure(figsize=(8, 6))

# Plot a histogram
plt.hist([1, 2, 3, 4, 5, 6, 7, 8, 9, 10])

plt.show()
Output:
Adjust Figure Size for Multiple Plots
You can adjust the figure size when creating multiple plots in Matplotlib.
import matplotlib.pyplot as plt

# Create a figure with a specified size
plt.figure(figsize=(12, 8))

# Plot multiple subplots
plt.subplot(2, 2, 1)
plt.plot([1, 2, 3, 4, 5], [1, 4, 9, 16, 25])

plt.subplot(2, 2, 2)
plt.bar([1, 2, 3, 4, 5], [10, 20, 15, 25, 30])

plt.subplot(2, 1, 2)
plt.scatter([1, 2, 3, 4, 5], [5, 10, 15, 20, 25])

plt.show()
Output:

Adjust Figure Size in Object-oriented Interface
You can adjust the figure size in Matplotlib when using the object-oriented interface.
import matplotlib.pyplot as plt

# Create a figure
fig, ax = plt.subplots()

# Set the figure size
fig.set_size_inches(10, 6)

# Plot a line chart using the ax object
ax.plot([1, 2, 3, 4, 5], [1, 4, 9, 16, 25])

plt.show()
Output:

Adjust Figure Size for Specific DPI
You can adjust the figure size in Matplotlib by setting the DPI (dots per inch) parameter.
import matplotlib.pyplot as plt

# Create a figure with a specific DPI
plt.figure(figsize=(10, 6), dpi=150)

# Plot a line chart
plt.plot([1, 2, 3, 4, 5], [1, 4, 9, 16, 25])

plt.show()
Output:
In conclusion, adjusting the figure size in Matplotlib is a useful technique that can help improve the appearance and readability of your plots. By using the methods and examples provided in this guide, you can easily customize the figure size to better suit your specific needs. Experiment with different sizes and layouts to create visually appealing and informative plots using Matplotlib.