Mastering Matplotlib Vertical Line: A Comprehensive Guide
Matplotlib vertical line is a powerful feature in data visualization that allows you to add vertical lines to your plots. This article will explore the various aspects of using vertical lines in Matplotlib, providing detailed explanations and practical examples to help you master this essential tool.
Understanding Matplotlib Vertical Line Basics
Matplotlib vertical line is a fundamental element in data visualization that can be used to highlight specific points, mark boundaries, or separate different regions in a plot. The primary function used to create a vertical line in Matplotlib is axvline(), which stands for “axis vertical line.”
Let’s start with a simple example to demonstrate how to add a Matplotlib vertical line to a plot:
import matplotlib.pyplot as plt
import numpy as np

# Generate sample data
x = np.linspace(0, 10, 100)
y = np.sin(x)

# Create the plot
plt.figure(figsize=(10, 6))
plt.plot(x, y, label='Sine wave')

# Add a vertical line
plt.axvline(x=5, color='r', linestyle='--', label='Vertical line')

plt.title('Matplotlib Vertical Line Example - how2matplotlib.com')
plt.xlabel('X-axis')
plt.ylabel('Y-axis')
plt.legend()
plt.grid(True)
plt.show()
Output:
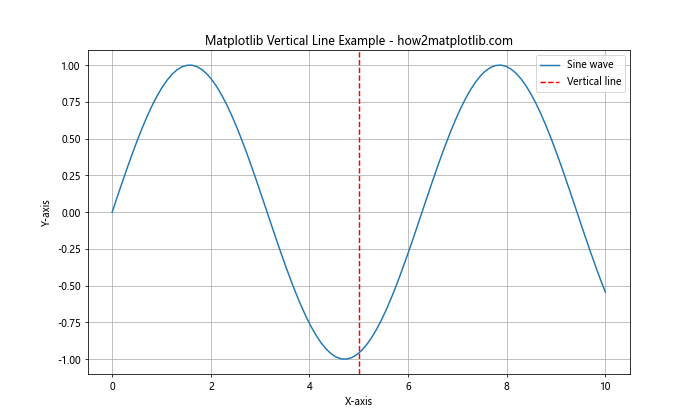
In this example, we create a simple sine wave plot and add a Matplotlib vertical line at x=5 using the axvline() function. The line is red, dashed, and labeled for clarity.
Customizing Matplotlib Vertical Line Appearance
One of the strengths of Matplotlib vertical line is its customizability. You can adjust various properties of the line to suit your visualization needs. Let’s explore some of these customization options:
Color and Line Style
You can change the color and line style of a Matplotlib vertical line using the color and linestyle parameters:
import matplotlib.pyplot as plt
import numpy as np

x = np.linspace(0, 10, 100)
y = np.cos(x)

plt.figure(figsize=(10, 6))
plt.plot(x, y, label='Cosine wave')

# Add customized vertical lines
plt.axvline(x=2, color='g', linestyle='-', linewidth=2, label='Solid green')
plt.axvline(x=4, color='b', linestyle=':', linewidth=2, label='Dotted blue')
plt.axvline(x=6, color='r', linestyle='-.', linewidth=2, label='Dash-dot red')

plt.title('Customized Matplotlib Vertical Lines - how2matplotlib.com')
plt.xlabel('X-axis')
plt.ylabel('Y-axis')
plt.legend()
plt.grid(True)
plt.show()
Output:
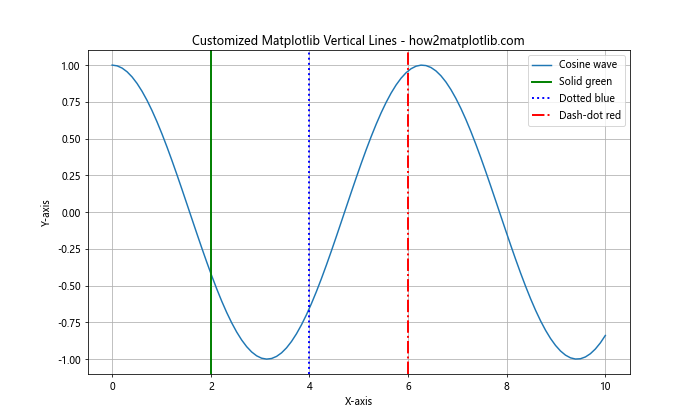
This example demonstrates different colors and line styles for Matplotlib vertical lines, including solid, dotted, and dash-dot styles.
Line Width and Alpha
You can adjust the width and transparency of a Matplotlib vertical line using the linewidth and alpha parameters:
import matplotlib.pyplot as plt
import numpy as np

x = np.linspace(0, 10, 100)
y = np.exp(-x/10) * np.sin(x)

plt.figure(figsize=(10, 6))
plt.plot(x, y, label='Damped sine wave')

# Add vertical lines with different widths and alpha values
plt.axvline(x=2, color='r', linewidth=1, alpha=1.0, label='Thin, opaque')
plt.axvline(x=4, color='g', linewidth=3, alpha=0.7, label='Medium, semi-transparent')
plt.axvline(x=6, color='b', linewidth=5, alpha=0.4, label='Thick, more transparent')

plt.title('Matplotlib Vertical Lines with Different Widths and Alpha - how2matplotlib.com')
plt.xlabel('X-axis')
plt.ylabel('Y-axis')
plt.legend()
plt.grid(True)
plt.show()
Output:
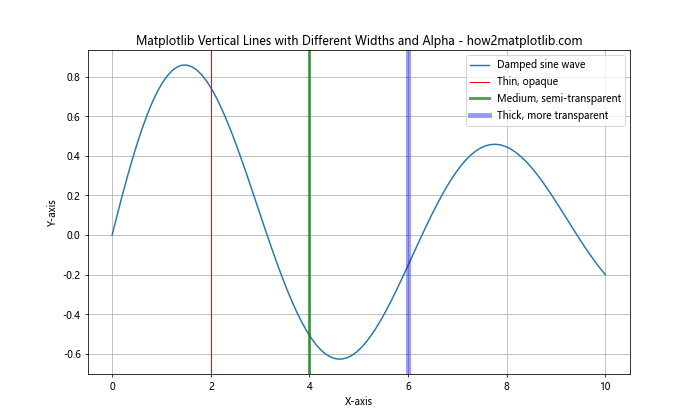
This example shows how to create Matplotlib vertical lines with varying widths and transparency levels.
Using Matplotlib Vertical Line for Data Analysis
Matplotlib vertical line can be a powerful tool for data analysis, helping to highlight important points or regions in your data. Let’s explore some practical applications:
Marking Thresholds
You can use Matplotlib vertical line to mark thresholds or critical values in your data:
import matplotlib.pyplot as plt
import numpy as np

# Generate sample data
np.random.seed(42)
x = np.linspace(0, 10, 100)
y = np.random.normal(loc=5, scale=2, size=100)

plt.figure(figsize=(10, 6))
plt.scatter(x, y, alpha=0.5, label='Data points')

# Add vertical lines to mark thresholds
plt.axvline(x=3, color='r', linestyle='--', label='Lower threshold')
plt.axvline(x=7, color='g', linestyle='--', label='Upper threshold')

plt.title('Using Matplotlib Vertical Line to Mark Thresholds - how2matplotlib.com')
plt.xlabel('X-axis')
plt.ylabel('Y-axis')
plt.legend()
plt.grid(True)
plt.show()
Output:
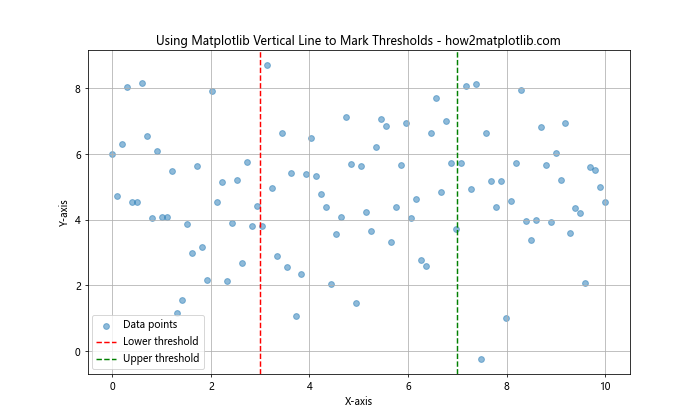
In this example, we use Matplotlib vertical lines to mark lower and upper thresholds in a scatter plot of random data.
Highlighting Time Points
Matplotlib vertical line can be particularly useful in time series analysis to highlight specific time points:
import matplotlib.pyplot as plt
import numpy as np
import pandas as pd

# Generate sample time series data
dates = pd.date_range(start='2023-01-01', end='2023-12-31', freq='D')
values = np.cumsum(np.random.randn(len(dates)))

plt.figure(figsize=(12, 6))
plt.plot(dates, values, label='Time series')

# Add vertical lines to highlight specific dates
plt.axvline(pd.Timestamp('2023-03-15'), color='r', linestyle='--', label='Q1 End')
plt.axvline(pd.Timestamp('2023-06-30'), color='g', linestyle='--', label='Q2 End')
plt.axvline(pd.Timestamp('2023-09-30'), color='b', linestyle='--', label='Q3 End')

plt.title('Highlighting Time Points with Matplotlib Vertical Line - how2matplotlib.com')
plt.xlabel('Date')
plt.ylabel('Value')
plt.legend()
plt.grid(True)
plt.xticks(rotation=45)
plt.tight_layout()
plt.show()
Output:
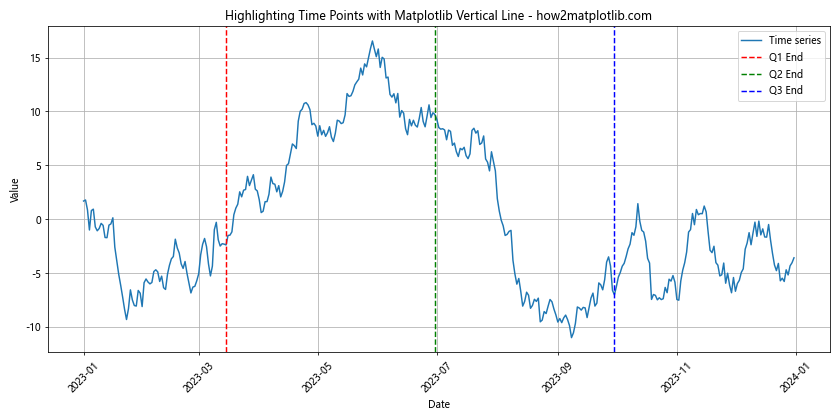
This example demonstrates how to use Matplotlib vertical line to highlight quarter-end dates in a time series plot.
Advanced Techniques with Matplotlib Vertical Line
As you become more comfortable with Matplotlib vertical line, you can explore more advanced techniques to enhance your visualizations:
Multiple Vertical Lines
You can add multiple Matplotlib vertical lines to a single plot to compare different points or regions:
import matplotlib.pyplot as plt
import numpy as np

x = np.linspace(0, 10, 100)
y1 = np.sin(x)
y2 = np.cos(x)

plt.figure(figsize=(10, 6))
plt.plot(x, y1, label='Sine')
plt.plot(x, y2, label='Cosine')

# Add multiple vertical lines
for i in range(1, 10, 2):
    plt.axvline(x=i, color='gray', alpha=0.5, linestyle='--')

plt.title('Multiple Matplotlib Vertical Lines - how2matplotlib.com')
plt.xlabel('X-axis')
plt.ylabel('Y-axis')
plt.legend()
plt.grid(True)
plt.show()
Output:
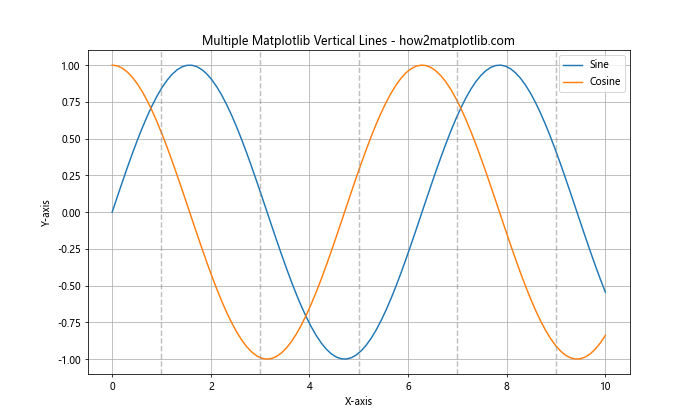
This example shows how to add multiple Matplotlib vertical lines at regular intervals to a plot with sine and cosine curves.
Vertical Lines with Text Annotations
You can combine Matplotlib vertical line with text annotations to provide additional context:
import matplotlib.pyplot as plt
import numpy as np

x = np.linspace(0, 10, 100)
y = np.exp(-x/5) * np.sin(x)

plt.figure(figsize=(12, 6))
plt.plot(x, y, label='Damped oscillation')

# Add vertical lines with text annotations
events = [(2, 'Peak'), (4, 'Zero crossing'), (6, 'Trough')]
for event_x, event_label in events:
    plt.axvline(x=event_x, color='r', linestyle='--')
    plt.text(event_x, plt.ylim()[1], event_label, rotation=90, va='bottom', ha='right')

plt.title('Matplotlib Vertical Lines with Text Annotations - how2matplotlib.com')
plt.xlabel('X-axis')
plt.ylabel('Y-axis')
plt.legend()
plt.grid(True)
plt.show()
Output:
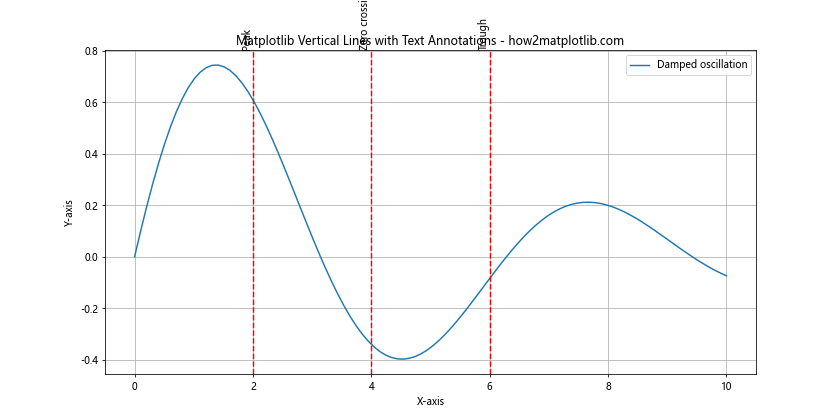
This example demonstrates how to add Matplotlib vertical lines with corresponding text annotations to highlight specific events in a damped oscillation plot.
Matplotlib Vertical Line in Subplots
Matplotlib vertical line can be used effectively in subplots to create more complex visualizations:
import matplotlib.pyplot as plt
import numpy as np

fig, (ax1, ax2) = plt.subplots(2, 1, figsize=(10, 8), sharex=True)

x = np.linspace(0, 10, 100)
y1 = np.sin(x)
y2 = np.cos(x)

ax1.plot(x, y1, label='Sine')
ax2.plot(x, y2, label='Cosine')

# Add vertical lines to both subplots
for ax in (ax1, ax2):
    ax.axvline(x=np.pi, color='r', linestyle='--', label='π')
    ax.axvline(x=2*np.pi, color='g', linestyle='--', label='2π')
    ax.legend()
    ax.grid(True)

ax1.set_title('Matplotlib Vertical Line in Subplots - how2matplotlib.com')
ax2.set_xlabel('X-axis')
ax1.set_ylabel('Y-axis (Sine)')
ax2.set_ylabel('Y-axis (Cosine)')

plt.tight_layout()
plt.show()
Output:
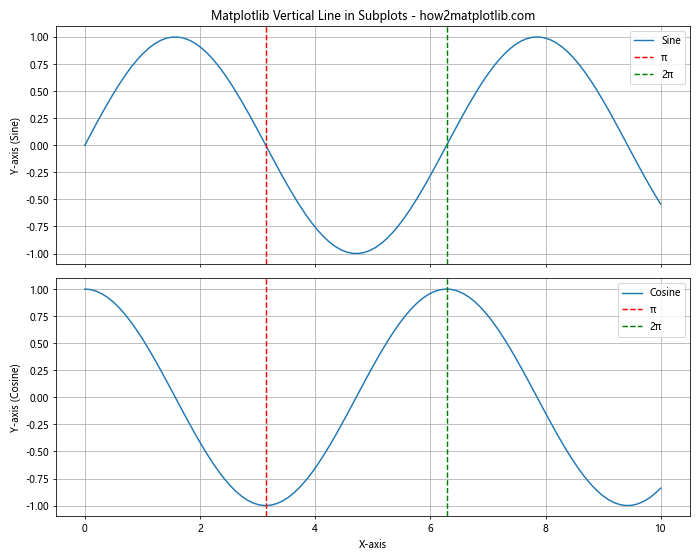
This example shows how to use Matplotlib vertical line in subplots to mark important points (π and 2π) in both sine and cosine plots.
Combining Matplotlib Vertical Line with Other Plot Types
Matplotlib vertical line can be combined with various other plot types to create informative visualizations:
Vertical Lines in Bar Charts
You can use Matplotlib vertical line to highlight specific bars or thresholds in a bar chart:
import matplotlib.pyplot as plt
import numpy as np

categories = ['A', 'B', 'C', 'D', 'E']
values = np.random.randint(10, 100, size=5)

plt.figure(figsize=(10, 6))
plt.bar(categories, values)

# Add a vertical line to mark the average
average = np.mean(values)
plt.axhline(y=average, color='r', linestyle='--', label=f'Average ({average:.2f})')

plt.title('Matplotlib Vertical Line in Bar Chart - how2matplotlib.com')
plt.xlabel('Categories')
plt.ylabel('Values')
plt.legend()
plt.grid(True, axis='y')
plt.show()
Output:
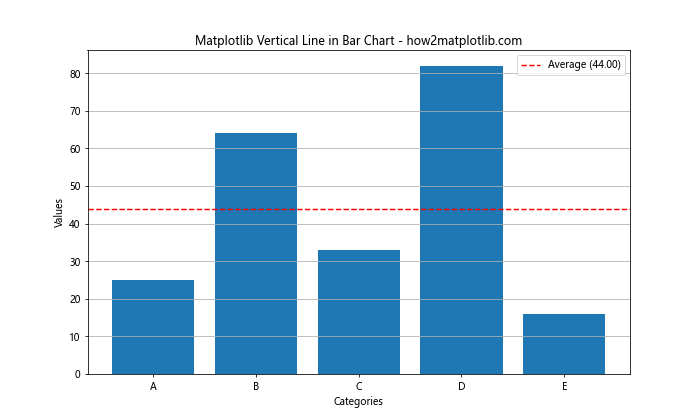
This example demonstrates how to use a horizontal Matplotlib vertical line (using axhline()) to mark the average value in a bar chart.
Vertical Lines in Scatter Plots
Matplotlib vertical line can be used to divide regions or mark boundaries in scatter plots:
import matplotlib.pyplot as plt
import numpy as np

np.random.seed(42)
x = np.random.randn(100)
y = 2 * x + np.random.randn(100)

plt.figure(figsize=(10, 6))
plt.scatter(x, y, alpha=0.5)

# Add vertical lines to divide the plot into regions
plt.axvline(x=0, color='r', linestyle='--', label='x = 0')
plt.axhline(y=0, color='g', linestyle='--', label='y = 0')

plt.title('Matplotlib Vertical Line in Scatter Plot - how2matplotlib.com')
plt.xlabel('X-axis')
plt.ylabel('Y-axis')
plt.legend()
plt.grid(True)
plt.show()
Output:
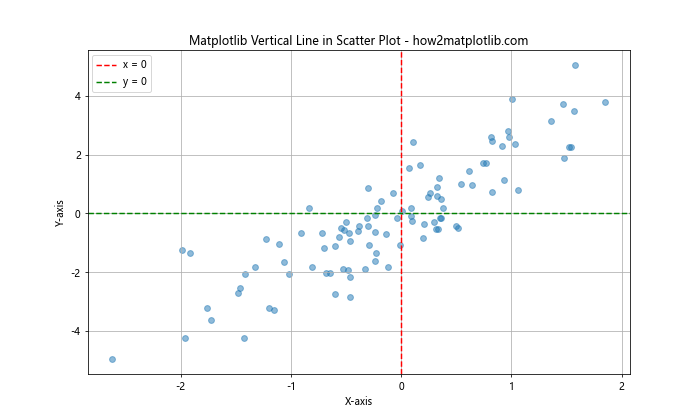
This example shows how to use Matplotlib vertical line and horizontal line to divide a scatter plot into quadrants.
Matplotlib Vertical Line in Time Series Analysis
Matplotlib vertical line is particularly useful in time series analysis for marking important events or time periods:
import matplotlib.pyplot as plt
import pandas as pd
import numpy as np

# Generate sample time series data
dates = pd.date_range(start='2023-01-01', end='2023-12-31', freq='D')
values = np.cumsum(np.random.randn(len(dates)))

plt.figure(figsize=(12, 6))
plt.plot(dates, values)

# Add vertical lines to mark seasons
seasons = [
    ('2023-03-20', 'Spring Equinox'),
    ('2023-06-21', 'Summer Solstice'),
    ('2023-09-22', 'Autumn Equinox'),
    ('2023-12-21', 'Winter Solstice')
]

for date, label in seasons:
    plt.axvline(x=pd.Timestamp(date), color='r', linestyle='--', alpha=0.7)
    plt.text(pd.Timestamp(date), plt.ylim()[1], label, rotation=90, va='bottom', ha='right')

plt.title('Matplotlib Vertical Line in Time Series Analysis - how2matplotlib.com')
plt.xlabel('Date')
plt.ylabel('Value')
plt.grid(True)
plt.xticks(rotation=45)
plt.tight_layout()
plt.show()
Output:
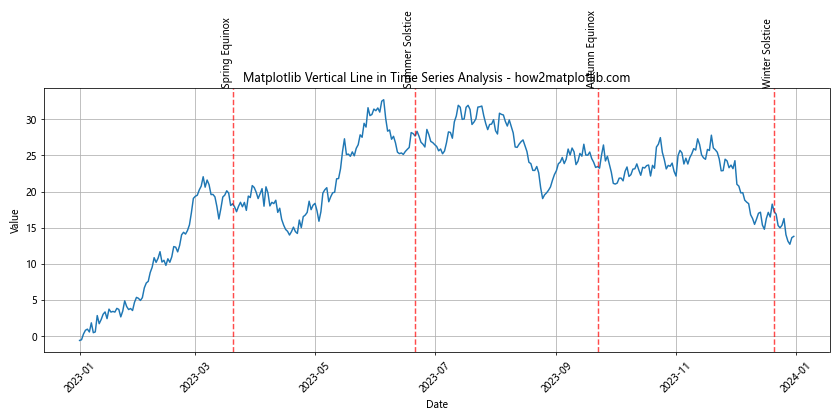
This example demonstrates how to use Matplotlib vertical line to mark seasonal changes in a time series plot.
Matplotlib Vertical Line for Comparison
Matplotlib vertical line can be an effective tool for comparing different datasets or highlighting differences:
import matplotlib.pyplot as plt
import numpy as np

x = np.linspace(0, 10, 100)
y1 = np.sin(x)
y2 = np.sin(x + np.pi/4)

plt.figure(figsize=(10, 6))
plt.plot(x, y1, label='Signal 1')
plt.plot(x, y2, label='Signal 2')

# Add vertical lines to highlight phase difference
plt.axvline(x=np.pi/2, color='r', linestyle='--', label='Signal 1 peak')
plt.axvline(x=np.pi/2 + np.pi/4, color='g', linestyle='--', label='Signal 2 peak')

plt.title('Using Matplotlib Vertical Line for Comparison - how2matplotlib.com')
plt.xlabel('X-axis')
plt.ylabel('Y-axis')
plt.legend()
plt.grid(True)
plt.show()
Output:
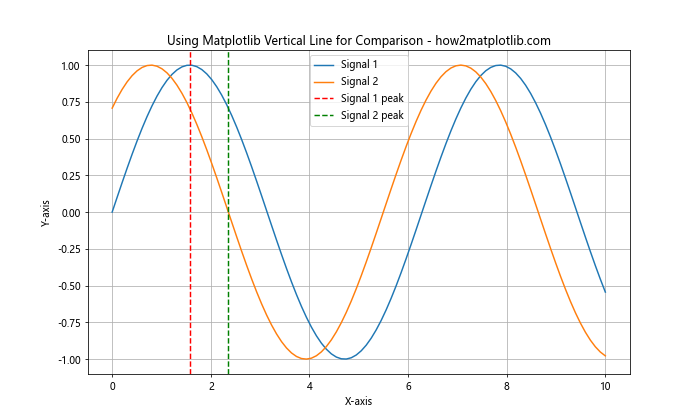
This example uses Matplotlib vertical line to highlight the phase difference between two sinusoidal signals.
Matplotlib Vertical Line in Statistical Visualization
Matplotlib vertical line can be valuable in statistical visualizations, such as histograms or density plots:
import matplotlib.pyplot as plt
import numpy as np
from scipy import stats

np.random.seed(42)
data = np.random.normal(loc=0, scale=1, size=1000)

plt.figure(figsize=(10, 6))
plt.hist(data, bins=30, density=True, alpha=0.7, color='skyblue')

# Add a density curve
xmin, xmax = plt.xlim()
x = np.linspace(xmin, xmax, 100)
p = stats.norm.pdf(x, loc=0, scale=1)
plt.plot(x, p, 'k', linewidth=2)

# Add vertical lines for mean and standard deviations
mean = np.mean(data)
std = np.std(data)
plt.axvline(x=mean, color='r', linestyle='--', label='Mean')
plt.axvline(x=mean + std, color='g', linestyle=':', label='+1 SD')
plt.axvline(x=mean - std, color='g', linestyle=':', label='-1 SD')

plt.title('Matplotlib Vertical Line in Statistical Visualization - how2matplotlib.com')
plt.xlabel('Value')
plt.ylabel('Density')
plt.legend()
plt.grid(True)
plt.show()
Output:
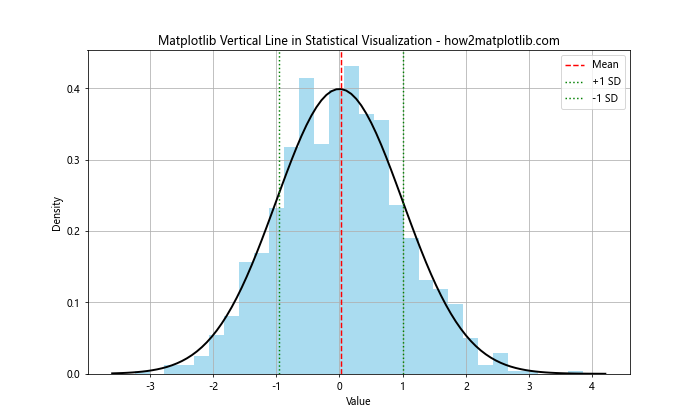
This example demonstrates how to use Matplotlib vertical line to mark the mean and standard deviations in a histogram with a normal distribution overlay.
Matplotlib Vertical Line for Event Marking
Matplotlib vertical line can be used to mark specific events or points of interest in various types of plots:
import matplotlib.pyplot as plt
import numpy as np
import pandas as pd

# Generate sample stock price data
dates = pd.date_range(start='2023-01-01', end='2023-12-31', freq='D')
prices = 100 + np.cumsum(np.random.randn(len(dates)) * 0.5)

plt.figure(figsize=(12, 6))
plt.plot(dates, prices)

# Mark important events
events = [
    ('2023-03-15', 'Earnings Report'),
    ('2023-06-30', 'Product Launch'),
    ('2023-09-22', 'Merger Announcement'),
    ('2023-12-01', 'CEO Change')
]

for date, label in events:
    plt.axvline(x=pd.Timestamp(date), color='r', linestyle='--', alpha=0.7)
    plt.text(pd.Timestamp(date), plt.ylim()[1], label, rotation=90, va='bottom', ha='right')

plt.title('Using Matplotlib Vertical Line for Event Marking - how2matplotlib.com')
plt.xlabel('Date')
plt.ylabel('Stock Price')
plt.grid(True)
plt.xticks(rotation=45)
plt.tight_layout()
plt.show()
Output:
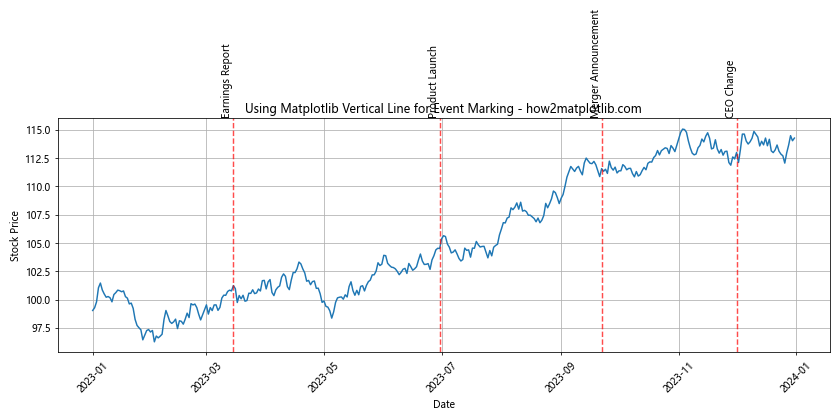
This example shows how to use Matplotlib vertical line to mark important events in a stock price chart.
Matplotlib Vertical Line in Multi-Axis Plots
Matplotlib vertical line can be particularly useful in plots with multiple y-axes to show relationships between different datasets:
import matplotlib.pyplot as plt
import numpy as np

fig, ax1 = plt.subplots(figsize=(10, 6))

x = np.linspace(0, 10, 100)
y1 = np.sin(x)
y2 = np.exp(x/10)

ax1.set_xlabel('X-axis')
ax1.set_ylabel('Sine', color='tab:blue')
ax1.plot(x, y1, color='tab:blue')
ax1.tick_params(axis='y', labelcolor='tab:blue')

ax2 = ax1.twinx()
ax2.set_ylabel('Exponential', color='tab:orange')
ax2.plot(x, y2, color='tab:orange')
ax2.tick_params(axis='y', labelcolor='tab:orange')

# Add vertical lines to highlight intersections
intersections = [1.85, 4.95, 8.05]
for i, xc in enumerate(intersections):
    plt.axvline(x=xc, color='r', linestyle='--', label=f'Intersection {i+1}' if i == 0 else '')

plt.title('Matplotlib Vertical Line in Multi-Axis Plot - how2matplotlib.com')
fig.legend(loc='upper left', bbox_to_anchor=(0.1, 0.9))
plt.grid(True)
plt.show()
Output:
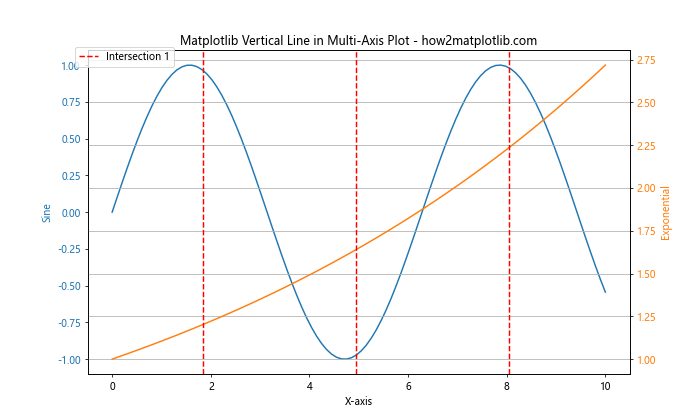
This example demonstrates how to use Matplotlib vertical line to highlight intersection points between two different functions plotted on separate y-axes.
Matplotlib Vertical Line with Shading
You can combine Matplotlib vertical line with shading to highlight specific regions of interest:
import matplotlib.pyplot as plt
import numpy as np

x = np.linspace(0, 10, 100)
y = np.sin(x) * np.exp(-x/10)

plt.figure(figsize=(10, 6))
plt.plot(x, y)

# Add vertical lines and shading
plt.axvline(x=2, color='r', linestyle='--', label='Start')
plt.axvline(x=8, color='g', linestyle='--', label='End')
plt.axvspan(2, 8, alpha=0.2, color='yellow')

plt.title('Matplotlib Vertical Line with Shading - how2matplotlib.com')
plt.xlabel('X-axis')
plt.ylabel('Y-axis')
plt.legend()
plt.grid(True)
plt.show()
Output:
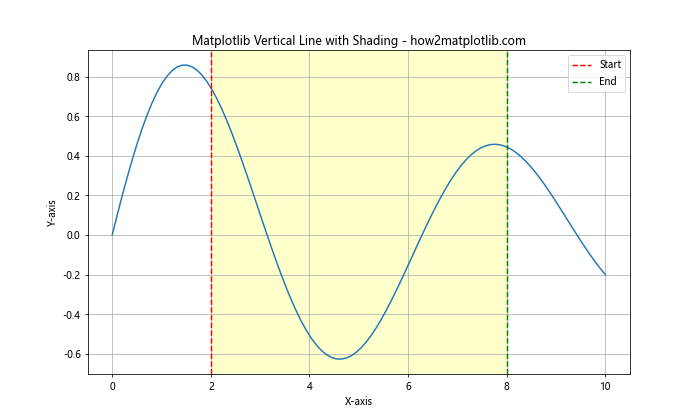
This example shows how to use Matplotlib vertical line in combination with axvspan() to highlight a specific region of the plot.
Matplotlib Vertical Line in 3D Plots
While less common, Matplotlib vertical line can also be used in 3D plots to mark specific planes:
import matplotlib.pyplot as plt
import numpy as np

fig = plt.figure(figsize=(10, 8))
ax = fig.add_subplot(111, projection='3d')

# Generate sample data
x = np.linspace(-5, 5, 100)
y = np.linspace(-5, 5, 100)
X, Y = np.meshgrid(x, y)
Z = np.sin(np.sqrt(X**2 + Y**2))

# Plot the surface
surf = ax.plot_surface(X, Y, Z, cmap='viridis')

# Add vertical planes
ax.plot([0, 0], [-5, 5], [-1, 1], 'r--', label='YZ plane')
ax.plot([-5, 5], [0, 0], [-1, 1], 'g--', label='XZ plane')

ax.set_xlabel('X-axis')
ax.set_ylabel('Y-axis')
ax.set_zlabel('Z-axis')
ax.set_title('Matplotlib Vertical Line in 3D Plot - how2matplotlib.com')
ax.legend()

plt.show()
Output:
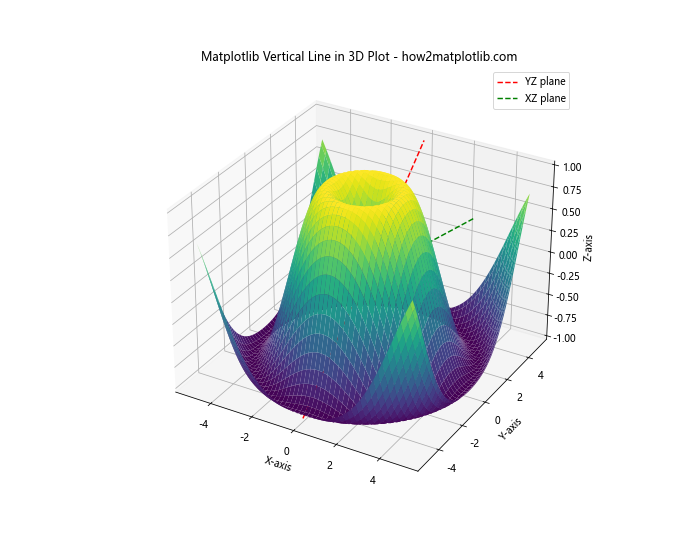
This example demonstrates how to use Matplotlib vertical line to represent planes in a 3D surface plot.
Best Practices for Using Matplotlib Vertical Line
When working with Matplotlib vertical line, consider the following best practices:
- Use appropriate colors and line styles that contrast well with your main plot.
- Add labels to your vertical lines to explain their significance.
- Use alpha values to make vertical lines less obtrusive if they’re meant as subtle guides.
- Combine vertical lines with horizontal lines or other plot elements when appropriate.
- Use vertical lines sparingly to avoid cluttering your plot.
Troubleshooting Common Issues with Matplotlib Vertical Line
Here are some common issues you might encounter when working with Matplotlib vertical line and how to resolve them:
- Vertical line not visible: Ensure that the x-value of your vertical line is within the range of your plot’s x-axis.
- Line style not applying: Double-check the spelling of your linestyle parameter (e.g., ‘–‘ for dashed, ‘:’ for dotted).
- Vertical line appears behind other plot elements: Use the
zorderparameter to control the drawing order. - Text annotations overlapping: Adjust the position of text using
va(vertical alignment) andha(horizontal alignment) parameters.
Matplotlib vertical line Conclusion
Matplotlib vertical line is a versatile and powerful tool for enhancing your data visualizations. From simple line plots to complex multi-axis and 3D visualizations, vertical lines can help highlight important features, mark events, and improve the overall clarity of your plots. By mastering the various techniques and best practices discussed in this article, you’ll be able to create more informative and visually appealing charts and graphs using Matplotlib.