Adding Space Between Subplots in Matplotlib
When creating multiple subplots in Matplotlib, it is common to want to add some space between the subplots to make the layout more aesthetically pleasing. In this article, we will go through several methods to achieve this in Matplotlib.
Method 1: Using subplots_adjust()
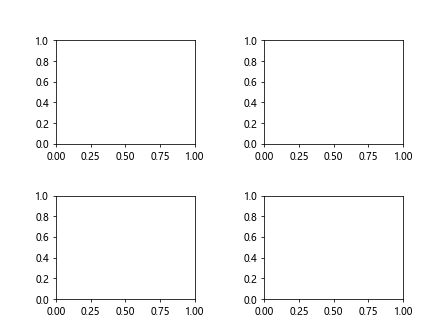
One way to add space between subplots is by using the subplots_adjust() method of the figure object. This method allows you to adjust the spacing between subplots using four parameters: left, right, bottom, and top.
import matplotlib.pyplot as plt

fig, axs = plt.subplots(2, 2)

plt.subplots_adjust(wspace=0.5, hspace=0.5)

plt.show()
Output:
Method 2: Using tight_layout()
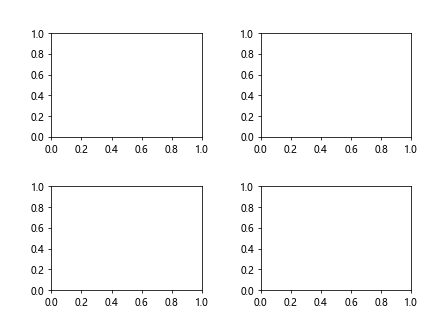
Another way to add space between subplots is by using the tight_layout() function in Matplotlib. This function automatically adjusts the spacing between subplots to make sure there is no overlap.
import matplotlib.pyplot as plt

fig, axs = plt.subplots(2, 2)

plt.tight_layout(pad=3.0)

plt.show()
Output:
Method 3: Using gridspec
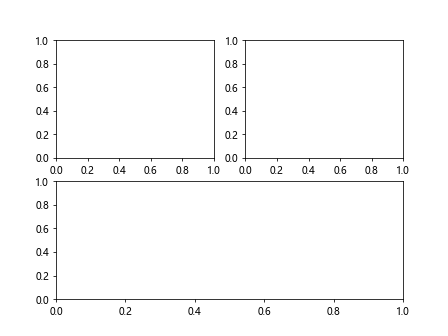
You can also use the GridSpec function in Matplotlib to create subplots with different sizes and spacings.
import matplotlib.pyplot as plt
from matplotlib.gridspec import GridSpec

fig = plt.figure()
gs = GridSpec(2, 2)

ax1 = fig.add_subplot(gs[0, 0])
ax2 = fig.add_subplot(gs[0, 1])
ax3 = fig.add_subplot(gs[1, :])

plt.show()
Output:
Method 4: Manually Adjusting Subplot Positions
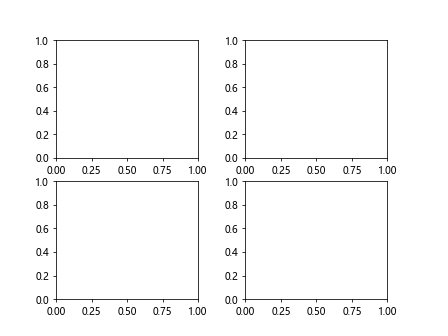
If you need more control over the spacing between subplots, you can manually adjust the positions of each subplot using the set_position() method.
import matplotlib.pyplot as plt

fig, axs = plt.subplots(2, 2)

for ax in axs.flat:
    box = ax.get_position()
    ax.set_position([box.x0, box.y0, box.width * 0.9, box.height])

plt.show()
Output:
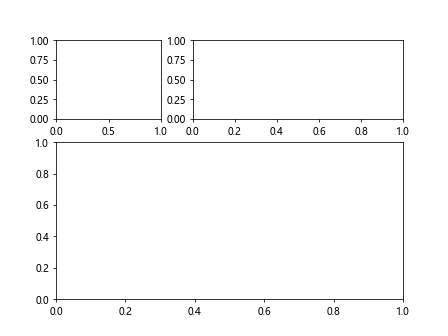
Method 5: Using GridSpec with Different Heights and Widths
You can use GridSpec to create subplots with different heights and widths, which can help you achieve the desired spacing between subplots.
import matplotlib.pyplot as plt
from matplotlib.gridspec import GridSpec

fig = plt.figure()
gs = GridSpec(2, 2, height_ratios=[1, 2], width_ratios=[1, 2])

ax1 = fig.add_subplot(gs[0, 0])
ax2 = fig.add_subplot(gs[0, 1])
ax3 = fig.add_subplot(gs[1, :])

plt.show()
Output:
Method 6: Using subplot_mosaic()
Matplotlib 3.4 introduced a new method called subplot_mosaic() which allows you to create subplots with custom layouts easily.
import matplotlib.pyplot as plt

fig = plt.figure()

fig.subplot_mosaic([['A', 'B'],
                    ['C', 'D']], pad=1.0)

plt.show()
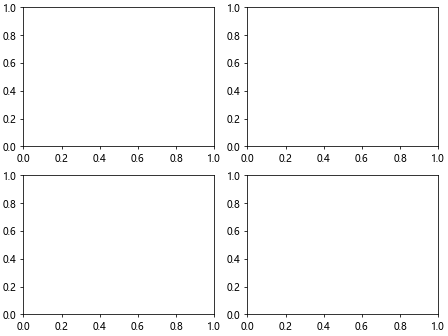
Method 7: Using constrained_layout
Another way to add space between subplots is by using the constrained_layout parameter when creating subplots.
import matplotlib.pyplot as plt

fig, axs = plt.subplots(2, 2, constrained_layout=True)

plt.show()
Output:
Method 8: Using subfigures
You can also create subfigures within a figure to add space between subplots.
import matplotlib.pyplot as plt

fig = plt.figure()

subfigs = fig.subfigures(2, 2)

plt.show()
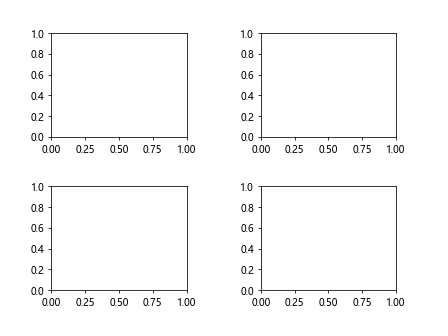
Method 9: Combining Different Methods
You can combine multiple methods to achieve the desired spacing between subplots.
import matplotlib.pyplot as plt

fig, axs = plt.subplots(2, 2)

plt.tight_layout(pad=3.0)

for ax in axs.flat:
    box = ax.get_position()
    ax.set_position([box.x0, box.y0, box.width * 0.9, box.height])

plt.show()
Output:
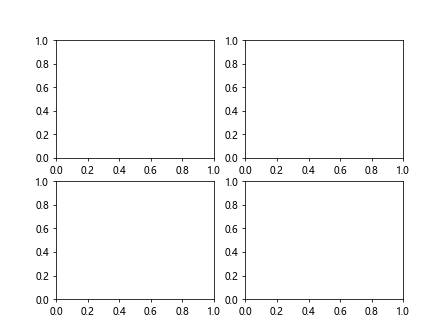
Method 10: Using subplot2grid
subplot2grid() allows you to create subplots using a grid layout and specify the position of each subplot within the grid.
import matplotlib.pyplot as plt

plt.subplot2grid((2, 2), (0, 0))
plt.subplot2grid((2, 2), (0, 1))
plt.subplot2grid((2, 2), (1, 0))
plt.subplot2grid((2, 2), (1, 1))

plt.show()
Output:
Conclusion
In this article, we have explored several methods to add space between subplots in Matplotlib. By using these techniques, you can create visually appealing layouts for your plots. Experiment with these methods to find the one that best suits your needs and design preferences.