Subplots and Savefig
In this article, we will explore how to use subplots in Matplotlib to create multiple plots within a single figure, and how to save these plots using the savefig function.
Creating Subplots
Matplotlib allows us to create subplots in a figure using the subplots function. This function returns a figure and a set of subplots which can be accessed using indexing.
import matplotlib.pyplot as plt

fig, axs = plt.subplots(2, 2)

axs[0, 0].plot([1, 2, 3, 4], [10, 15, 13, 18])
axs[0, 0].set_title('Subplot 1')

axs[0, 1].scatter([1, 2, 3, 4], [10, 15, 13, 18])
axs[0, 1].set_title('Subplot 2')

plt.show()
Output:

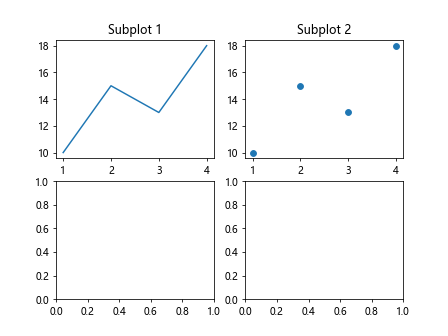
In this example, we create a 2×2 grid of subplots and plot a line in the first subplot and a scatter plot in the second subplot.
Customizing Subplots
We can customize the layout of subplots by adjusting the spacing between them using the subplots_adjust function.
import matplotlib.pyplot as plt

fig, axs = plt.subplots(1, 2)

fig.subplots_adjust(wspace=0.5)

axs[0].plot([1, 2, 3, 4], [10, 15, 13, 18])
axs[0].set_title('Subplot 1')

axs[1].scatter([1, 2, 3, 4], [10, 15, 13, 18])
axs[1].set_title('Subplot 2')

plt.show()
Output:

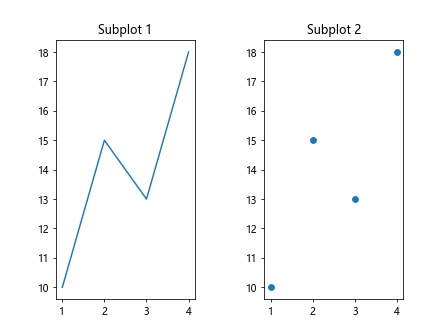
In this example, we increase the horizontal spacing between the subplots by setting wspace to 0.5.
Saving Subplots
Once we have created our subplots, we can save the entire figure containing the subplots using the savefig function.
fig.savefig('plot.png')
This code will save the figure as a PNG image with the filename plot.png.
Customizing Save Options
We can customize the save options when using the savefig function, such as setting the DPI and specifying the file format.
fig.savefig('plot.jpg', dpi=300, format='jpg')
In this example, we save the figure as a JPEG image with a resolution of 300 DPI.
Saving Subplots to PDF
We can also save the entire figure containing the subplots as a PDF file.
fig.savefig('plot.pdf', format='pdf')
This code will save the figure as a PDF file with the filename plot.pdf.
Saving Multiple Subplots
If we have multiple subplots in a single figure, we can save them all at once using the savefig function.
import matplotlib.pyplot as plt

fig, axs = plt.subplots(2, 2)

axs[0, 0].plot([1, 2, 3, 4], [10, 15, 13, 18])
axs[0, 0].set_title('Subplot 1')

axs[0, 1].scatter([1, 2, 3, 4], [10, 15, 13, 18])
axs[0, 1].set_title('Subplot 2')

axs[1, 0].bar([1, 2, 3, 4], [10, 15, 13, 18])
axs[1, 0].set_title('Subplot 3')

axs[1, 1].hist([1, 2, 2, 3, 3, 3, 4, 4, 4, 4])
axs[1, 1].set_title('Subplot 4')

fig.savefig('multiplot.png')
plt.show()
Output:

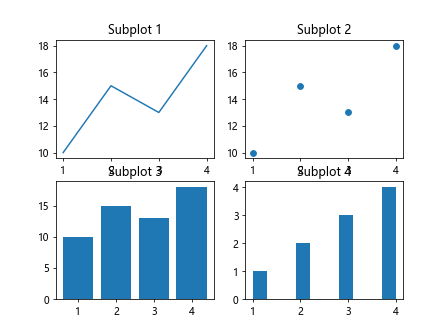
In this example, we create four subplots in a 2×2 grid and save the entire figure as a PNG image.
Saving Subplots with Custom Size
We can specify the size of the saved figure when using the savefig function by setting the figsize parameter.
import matplotlib.pyplot as plt

fig, axs = plt.subplots(2, 2)

fig.set_size_inches(10, 8)

axs[0, 0].plot([1, 2, 3, 4], [10, 15, 13, 18])
axs[0, 0].set_title('Subplot 1')

axs[0, 1].scatter([1, 2, 3, 4], [10, 15, 13, 18])
axs[0, 1].set_title('Subplot 2')

fig.savefig('customsize.png')
In this example, we set the size of the figure to 10×8 inches before saving it as a PNG image.
Saving Subplots with Transparent Background
We can save the figure containing subplots with a transparent background by specifying the transparent parameter in the savefig function.
fig.savefig('transparent.png', transparent=True)
This code will save the figure as a PNG image with a transparent background.
Saving Subplots with High Resolution
To save subplots with high resolution, we can set the DPI parameter to a higher value when using the savefig function.
fig.savefig('highres.png', dpi=300)
In this example, we save the figure as a PNG image with a resolution of 300 DPI.
Saving Subplots to Different Formats
Matplotlib allows us to save subplots in different image formats such as PNG, JPEG, and PDF by specifying the format parameter in the savefig function.
fig.savefig('plot.jpg', format='jpg')
fig.savefig('plot.pdf', format='pdf')
In these examples, we save the figure as a JPEG image and a PDF file respectively.
Conclusion
In this article, we have explored how to create subplots in Matplotlib and save them using the savefig function. By customizing the layout and save options, we can create and save multiple plots efficiently. Matplotlib’s flexibility in creating and saving subplots makes it a powerful tool for data visualization.