Title of Subplot in Matplotlib
In this article, we will explore how to create subplots in Matplotlib and customize titles for each subplot. Subplots are useful when you want to display multiple plots within the same figure. By customizing the titles of subplots, you can provide additional information or context to each plot.
Creating Subplots
To create subplots in Matplotlib, you can use the plt.subplots() function. This function allows you to specify the number of rows and columns for your subplots, as well as the size of the figure. Let’s see an example:
import matplotlib.pyplot as plt

# Create a figure with 2 rows and 2 columns
fig, axs = plt.subplots(2, 2, figsize=(10, 8))
plt.show()
Output:
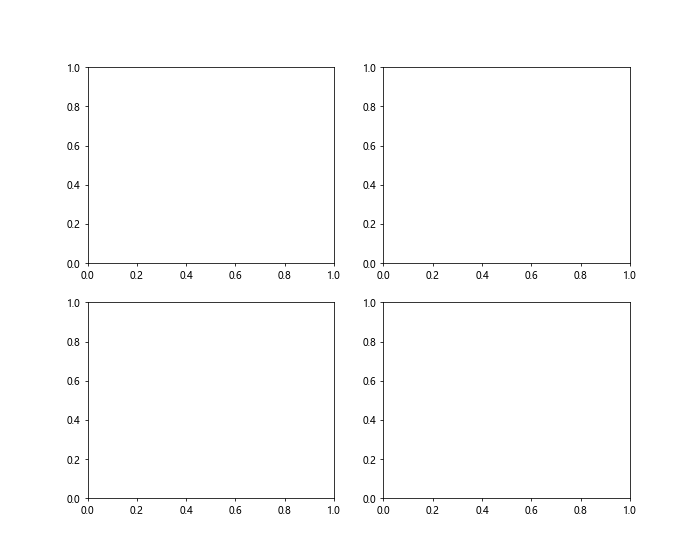
In this example, we create a figure with 2 rows and 2 columns. We also specify the size of the figure to be 10 inches wide and 8 inches tall.
Customizing Subplot Titles
To customize the titles of subplots, you can use the set_title() method on each AxesSubplot object. This method allows you to set the title for each subplot individually. Here’s an example:
import matplotlib.pyplot as plt

# Create a figure with 2 rows and 2 columns
fig, axs = plt.subplots(2, 2, figsize=(10, 8))

# Set titles for each subplot
axs[0, 0].set_title("Subplot 1")
axs[0, 1].set_title("Subplot 2")
axs[1, 0].set_title("Subplot 3")
axs[1, 1].set_title("Subplot 4")

plt.show()
Output:
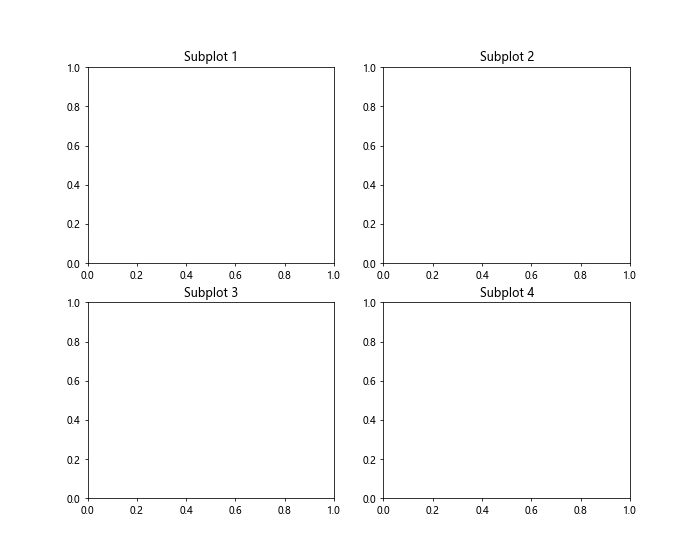
In this example, we set titles for each of the four subplots in the figure. Each subplot can have its own custom title to provide additional information about the plot.
Changing Title Properties
You can also customize the properties of the subplot titles, such as the font size, font weight, font style, and color. By using the set_title() method and specifying additional parameters, you can change the appearance of the titles. Here’s an example:
import matplotlib.pyplot as plt

# Create a figure with 2 rows and 2 columns
fig, axs = plt.subplots(2, 2, figsize=(10, 8))

# Set titles with custom properties
axs[0, 0].set_title("Subplot 1", fontsize=14, fontweight='bold', fontstyle='italic', color='blue')
axs[0, 1].set_title("Subplot 2", fontsize=12, fontweight='normal', fontstyle='normal', color='green')
axs[1, 0].set_title("Subplot 3", fontsize=16, fontweight='bold', fontstyle='normal', color='red')
axs[1, 1].set_title("Subplot 4", fontsize=10, fontweight='bold', fontstyle='italic', color='purple')

plt.show()
Output:
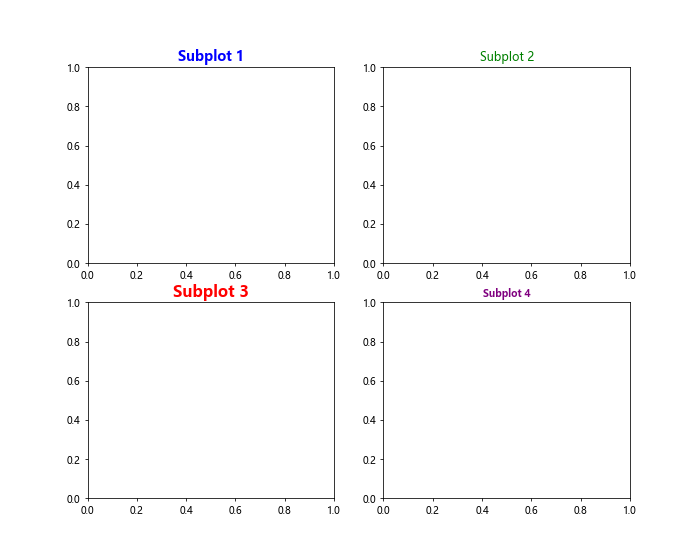
In this example, we customize the properties of the subplot titles by changing the font size, font weight, font style, and color for each subplot. This allows you to make the titles more visually appealing and informative.
Positioning Subplot Titles
In addition to customizing the properties of the subplot titles, you can also adjust the position of the titles within each subplot. This can be done by specifying the y parameter in the set_title() method to change the vertical position of the title. Let’s see an example:
import matplotlib.pyplot as plt

# Create a figure with 2 rows and 2 columns
fig, axs = plt.subplots(2, 2, figsize=(10, 8))

# Set titles with custom positions
axs[0, 0].set_title("Subplot 1", y=1.1)
axs[0, 1].set_title("Subplot 2", y=0.9)
axs[1, 0].set_title("Subplot 3", y=1.0)
axs[1, 1].set_title("Subplot 4", y=1.2)

plt.show()
Output:
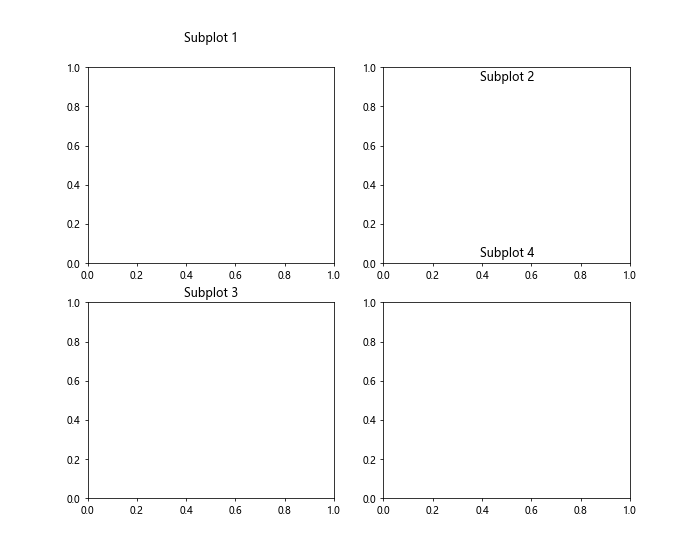
In this example, we adjust the vertical position of the subplot titles by specifying the y parameter in the set_title() method. This allows you to control where the titles are positioned within each subplot.
Adding Subplot Titles to a Grid
When working with a large number of subplots arranged in a grid, it can be useful to add a common title to the entire grid. This can be accomplished by using the suptitle() method on the figure object. Let’s see an example:
import matplotlib.pyplot as plt

# Create a figure with 3 rows and 3 columns
fig, axs = plt.subplots(3, 3, figsize=(12, 10))

# Set titles for each subplot
for i in range(3):
    for j in range(3):
        axs[i, j].set_title(f"Subplot {i+1}-{j+1}")

# Add a common title to the entire grid
fig.suptitle("Grid of Subplots")

plt.show()
Output:
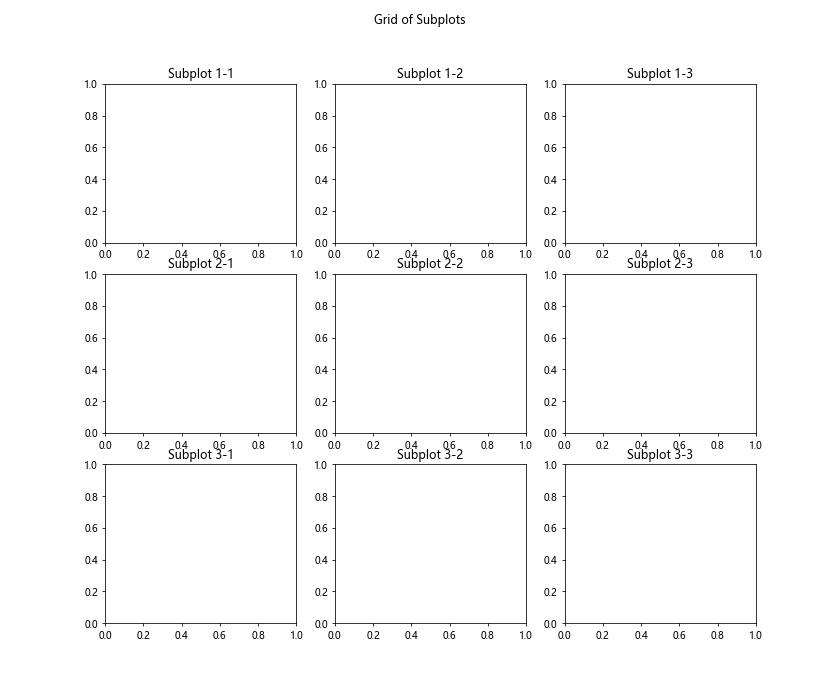
In this example, we create a 3×3 grid of subplots and set titles for each subplot. We then use the suptitle() method on the figure object to add a common title to the entire grid.
Using Subplot Titles in a Loop
If you have a large number of subplots and want to set titles in a loop, you can use a nested loop to iterate over each subplot. This allows you to set titles for each subplot dynamically based on the loop indices. Here’s an example:
import matplotlib.pyplot as plt

# Create a figure with 4 rows and 4 columns
fig, axs = plt.subplots(4, 4, figsize=(12, 12))

# Set titles for each subplot using a loop
for i in range(4):
    for j in range(4):
        axs[i, j].set_title(f"Subplot {i+1}-{j+1}")

plt.show()
Output:

In this example, we use nested loops to iterate over each subplot in a 4×4 grid and set titles dynamically based on the loop indices. This approach is useful for setting titles for a large number of subplots efficiently.
Customizing Title Alignment
You can also adjust the alignment of subplot titles within each subplot by using the ha and va parameters in the set_title() method. These parameters allow you to control the horizontal and vertical alignment of the titles, respectively. Here’s an example:
import matplotlib.pyplot as plt

# Create a figure with 2 rows and 2 columns
fig, axs = plt.subplots(2, 2, figsize=(10, 8))

# Set titles with custom alignments
axs[0, 0].set_title("Subplot 1", ha='left', va='top')
axs[0, 1].set_title("Subplot 2", ha='center', va='center')
axs[1, 0].set_title("Subplot 3", ha='right', va='bottom')
axs[1, 1].set_title("Subplot 4", ha='center', va='bottom')

plt.show()
Output:
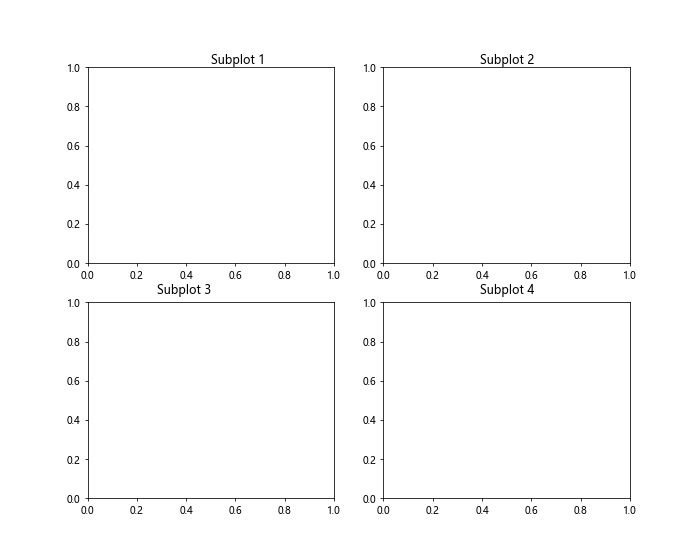
In this example, we customize the horizontal and vertical alignment of the subplot titles by specifying the ha and va parameters in the set_title() method. This allows you to control the alignment of the titles within each subplot.
Rotating Subplot Titles
If you have long subplot titles that may overlap with other elements in the plot, you can rotate the titles to make them more readable. This can be done by specifying the rotation parameter in the set_title() method. Let’s see an example:
import matplotlib.pyplot as plt

# Create a figure with 2 rows and 2 columns
fig, axs = plt.subplots(2, 2, figsize=(10, 8))

# Set titles with custom rotations
axs[0, 0].set_title("Subplot with a Long Title", rotation=45)
axs[0, 1].set_title("Another Subplot with a Long Title", rotation=90)
axs[1, 0].set_title("Subplot 3", rotation=0)
axs[1, 1].set_title("Subplot 4", rotation=-45)

plt.show()
Output:
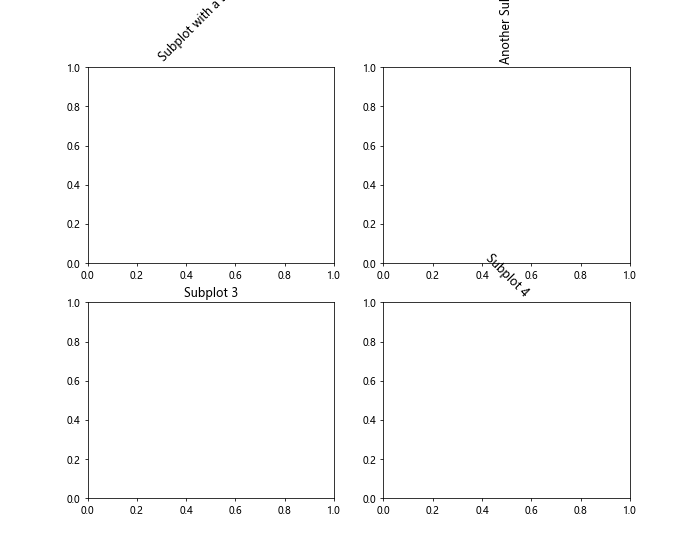
In this example, we rotate the subplot titles by specifying the rotation parameter in the set_title() method. This allows you to adjust the angle at which the titles are displayed, making them more readable if they are long or overlapping with other elements in the plot.
Using Line Breaks in Subplot Titles
If you want to display multiline titles in subplots, you can use line breaks to separate different lines of text. This can be achieved by using the escape sequence \n within the title string. Let’s see an example:
import matplotlib.pyplot as plt

# Create a figure with 2 rows and 2 columns
fig, axs = plt.subplots(2, 2, figsize=(10, 8))

# Set titles with line breaks
axs[0, 0].set_title("Subplot 1\nLine 2")
axs[0, 1].set_title("Subplot 2\nAdditional Info")
axs[1, 0].set_title("Subplot 3\nDescription")
axs[1, 1].set_title("Subplot 4\nDetails")

plt.show()
Output:
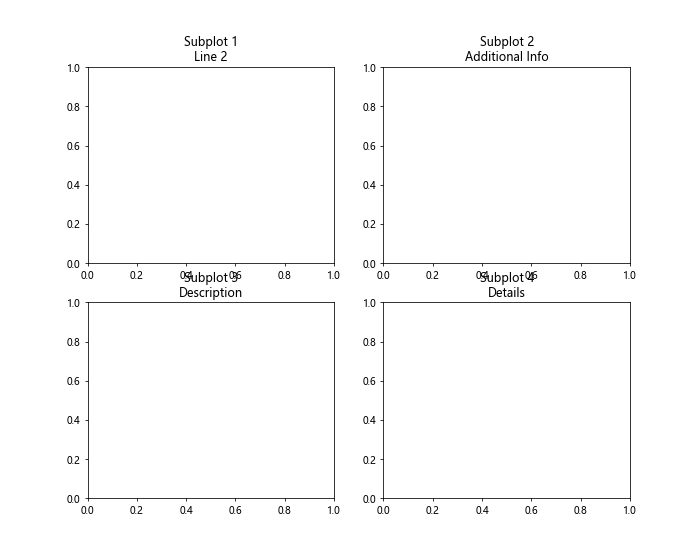
In this example, we use the escape sequence \n to create line breaks within the subplot titles. This allows you to display multiline titles with different lines of text for each subplot.
Combining Text and Variables in Subplot Titles
You can also combine static text and variable values in subplot titles to provide more dynamic information. This can be done by using f-strings to format the title string with variable values. Let’s see an example:
import matplotlib.pyplot as plt

# Define variable values
value1 = 10
value2 = 20
value3 = 30

# Create a figure with 2 rows and 2 columns
fig, axs = plt.subplots(2, 2, figsize=(10, 8))

# Set titles with dynamic text
axs[0, 0].set_title(f"Subplot 1: {value1}")
axs[0, 1].set_title(f"Subplot 2: {value2}")
axs[1, 0].set_title(f"Subplot 3: {value3}")

plt.show()
Output:
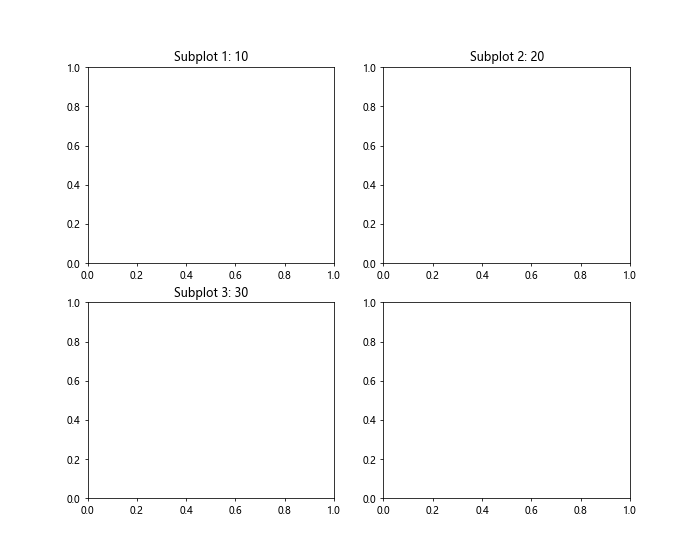
In this example, we define variable values and use f-strings to format the subplot titles dynamically with the variable values. This allows you to combine static text with variable values in the subplot titles.
Setting Subplot Titles Based on Data
If you have a dataset and want to use specific data values as subplot titles, you can extract the data and set the titles based on the data values. This can be achieved by accessing the data values and formatting them as needed in the subplot titles. Let’s see an example:
import matplotlib.pyplot as plt

# Sample data
data = [10, 20, 30, 40]

# Create a figure with 2 rows and 2 columns
fig, axs = plt.subplots(2, 2, figsize=(10, 8))

# Set titles based on data values
for i in range(4):
    axs[i // 2, i % 2].set_title(f"Value: {data[i]}")

plt.show()
Output:
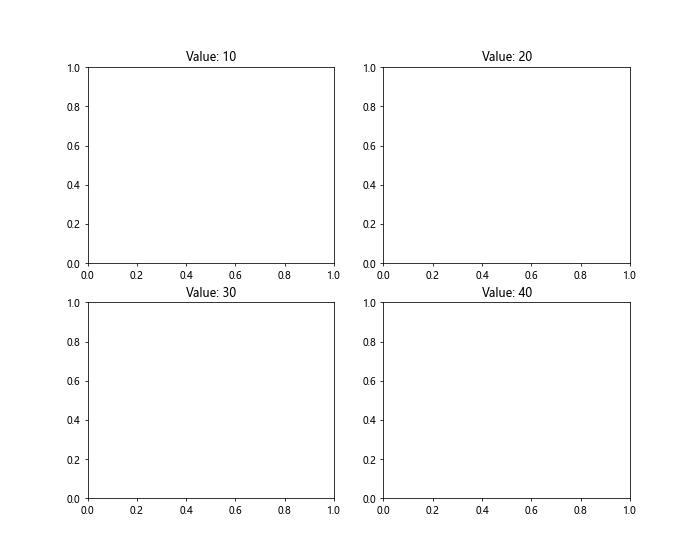
In this example, we use sample data values and set subplot titles based on the data values by iterating over the data and formatting the titles dynamically. This approach allows you to set titles for each subplot based on specific data values.
Conclusion
In this article, we have explored how to create subplots in Matplotlib and customize titles for each subplot. By using the set_title() method and various parameters, you can customize the appearance, alignment, rotation, and content of subplot titles. Whether you need to display multiline titles, combine text and variables, or set titles based on data values, Matplotlib offers flexibility and customization options for creating informative and visually appealing subplot titles. Experiment with different customization techniques to enhance the presentation of your plots and provide additional context to your audience.