Adjusting Tick Parameters Font Size
In this article, we will explore how to adjust the font size of tick parameters in matplotlib plots. Tick parameters include tick labels, tick marks, and axis labels. By customizing the font size of tick parameters, we can enhance the readability and aesthetics of our plots.
Setting the Font Size for Tick Labels
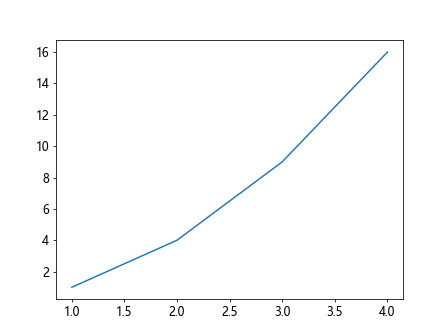
We can adjust the font size of tick labels by using the fontsize parameter in the tick_params() method. Below is an example of how to set the font size of tick labels to 12.
import matplotlib.pyplot as plt

plt.plot([1, 2, 3, 4], [1, 4, 9, 16])

plt.tick_params(axis='both', labelsize=12)

plt.show()
Output:
Changing the Font Size of Tick Marks
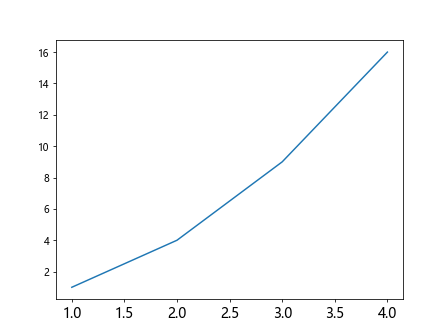
To change the font size of tick marks on the axes, we can use the which parameter in the tick_params() method along with the labelsize parameter. The which parameter specifies which tick marks to apply the settings to.
import matplotlib.pyplot as plt

plt.plot([1, 2, 3, 4], [1, 4, 9, 16])

plt.tick_params(axis='x', which='major', labelsize=14)
plt.tick_params(axis='y', which='minor', labelsize=10)

plt.show()
Output:
Adjusting the Font Size of Axis Labels
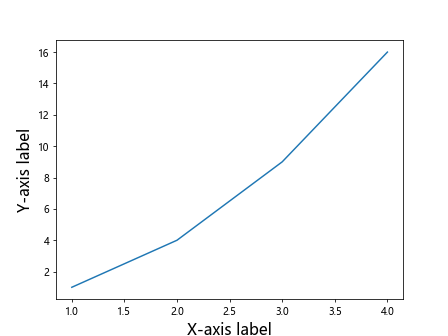
We can also customize the font size of the axis labels by using the fontsize parameter in the set_xlabel() and set_ylabel() methods.
import matplotlib.pyplot as plt

plt.plot([1, 2, 3, 4], [1, 4, 9, 16])

plt.xlabel('X-axis label', fontsize=16)
plt.ylabel('Y-axis label', fontsize=16)

plt.show()
Output:
Setting Different Font Sizes for Tick Parameters
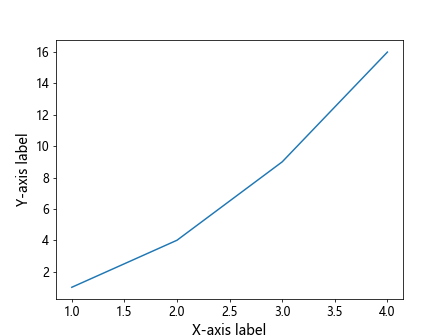
In some cases, we may want to set different font sizes for tick labels, tick marks, and axis labels. This can be achieved by specifying the font sizes separately for each parameter.
import matplotlib.pyplot as plt

plt.plot([1, 2, 3, 4], [1, 4, 9, 16])

plt.tick_params(axis='both', labelsize=12)
plt.xlabel('X-axis label', fontsize=14)
plt.ylabel('Y-axis label', fontsize=14)

plt.show()
Output:
Adjusting Font Size for Specific Axis
If we only want to change the font size for a specific axis, we can do so by specifying the axis parameter in the tick_params() method.
import matplotlib.pyplot as plt

plt.plot([1, 2, 3, 4], [1, 4, 9, 16])

plt.tick_params(axis='x', labelsize=12)
plt.tick_params(axis='y', labelsize=14)

plt.show()
Output:
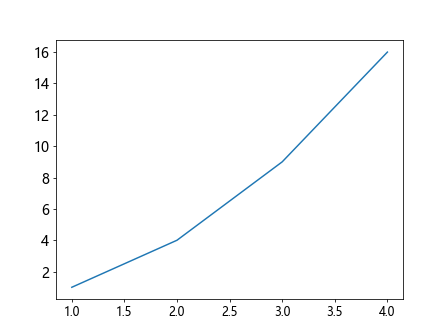
Rotating Tick Labels
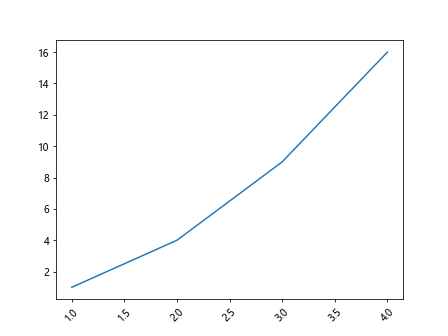
In addition to adjusting the font size of tick labels, we can also rotate the tick labels to improve readability. This can be done by setting the rotation parameter in the tick_params() method.
import matplotlib.pyplot as plt

plt.plot([1, 2, 3, 4], [1, 4, 9, 16])

plt.tick_params(axis='x', labelrotation=45)

plt.show()
Output:
Changing Font Size of Tick Parameters in Subplots
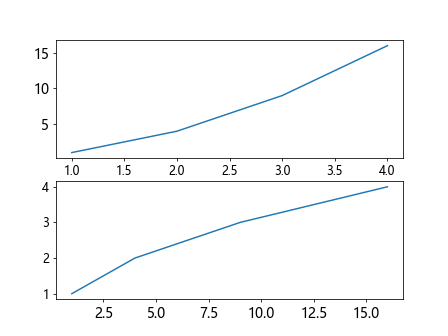
When working with subplots, we may need to adjust the font size of tick parameters for each subplot individually. We can accomplish this by specifying the subplot index in the tick_params() method.
import matplotlib.pyplot as plt

fig, axs = plt.subplots(2)
axs[0].plot([1, 2, 3, 4], [1, 4, 9, 16])
axs[1].plot([1, 4, 9, 16], [1, 2, 3, 4])

axs[0].tick_params(axis='x', labelsize=12)
axs[0].tick_params(axis='y', labelsize=14)
axs[1].tick_params(axis='x', labelsize=14)
axs[1].tick_params(axis='y', labelsize=12)

plt.show()
Output:
Changing Font Size of Tick Parameters in Scatter Plots
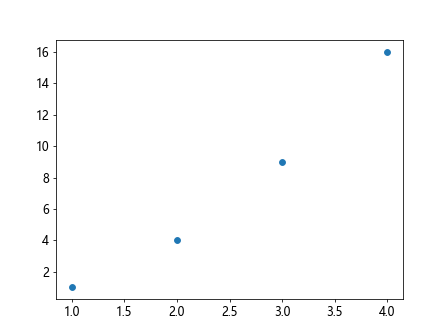
When creating scatter plots, we can adjust the font size of tick parameters to improve readability and visual appeal. The following example demonstrates how to set the font size of tick labels in a scatter plot.
import matplotlib.pyplot as plt

x = [1, 2, 3, 4]
y = [1, 4, 9, 16]

plt.scatter(x, y)

plt.tick_params(axis='both', labelsize=12)

plt.show()
Output:
Customizing Font Size for Polar Plots
For polar plots, we can customize the font size of tick parameters to suit the circular orientation of the plot. The following code snippet illustrates how to adjust the font size of tick labels in a polar plot.
import matplotlib.pyplot as plt
import numpy as np

r = np.linspace(0, 10, 100)
theta = 2 * np.pi * r

plt.subplot(111, polar=True)
plt.plot(theta, r)

plt.tick_params(axis='both', labelsize=12)

plt.show()
Output:

Adjusting Font Size for Logarithmic Plots
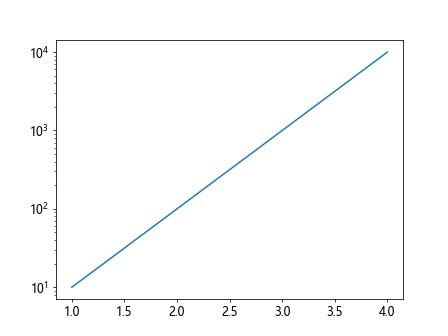
In logarithmic plots, we may need to adjust the font size of tick parameters to ensure clarity and legibility. The following example shows how to set the font size of tick labels in a logarithmic plot.
import matplotlib.pyplot as plt

x = [1, 2, 3, 4]
y = [10, 100, 1000, 10000]

plt.plot(x, y)
plt.yscale('log')

plt.tick_params(axis='both', labelsize=12)

plt.show()
Output:
Summary
In this article, we have explored various ways to adjust the font size of tick parameters in matplotlib plots. By customizing the font size of tick labels, tick marks, and axis labels, we can enhance the visual representation of our plots and improve their readability. Experiment with different font sizes and styles to find the best combination that suits your plot aesthetics.