How to Change Scale in Matplotlib
Matplotlib is a popular library in Python used for creating static, animated, and interactive visualizations. One important aspect of creating visualizations is being able to manipulate the scale of the plots to better showcase the data. In this article, we will explore different ways to change the scale in Matplotlib.
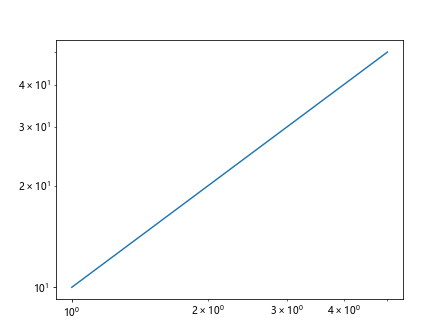
1. Changing the Scale of the x-axis and y-axis
You can change the scale of the x-axis and y-axis in Matplotlib using the set_xscale() and set_yscale() methods.
import matplotlib.pyplot as plt

# Create some data
x = [1, 2, 3, 4, 5]
y = [10, 20, 30, 40, 50]

plt.plot(x, y)

# Change the scale of the x-axis to logarithmic
plt.xscale('log')

# Change the scale of the y-axis to logarithmic
plt.yscale('log')

plt.show()
Output:

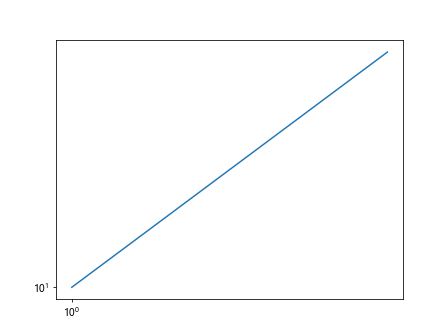
2. Changing the Scale of Specific Axes
You can also change the scale of specific axes in a plot by accessing the axes object.
import matplotlib.pyplot as plt

# Create some data
x = [1, 2, 3, 4, 5]
y = [10, 20, 30, 40, 50]

fig, ax = plt.subplots()

ax.plot(x, y)

# Change the scale of the x-axis to logarithmic
ax.set_xscale('log')

# Change the scale of the y-axis to logarithmic
ax.set_yscale('log')

plt.show()
Output:
3. Setting a Custom Scale
You can set a custom scale for the axes using the set_xscale() and set_yscale() methods with the value parameter.
import matplotlib.pyplot as plt

# Create some data
x = [1, 2, 3, 4, 5]
y = [10, 20, 30, 40, 50]

plt.plot(x, y)

# Set a custom scale for the x-axis
plt.xscale('symlog', linthresh=0.5)

# Set a custom scale for the y-axis
plt.yscale('symlog', linthresh=10)

plt.show()
Output:
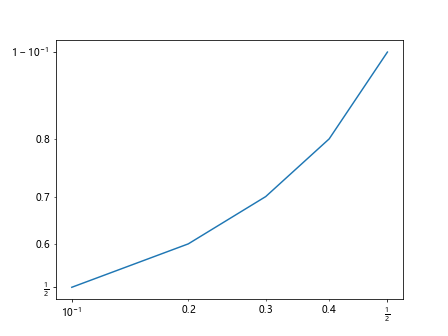
4. Using a Logit Scale
The logit scale is a special scale used for plotting values between 0 and 1. You can use the logit scale for both the x-axis and y-axis.
import matplotlib.pyplot as plt

# Create some data
x = [0.1, 0.2, 0.3, 0.4, 0.5]
y = [0.5, 0.6, 0.7, 0.8, 0.9]

plt.plot(x, y)

# Change the scale of the x-axis to logit
plt.xscale('logit')

# Change the scale of the y-axis to logit
plt.yscale('logit')

plt.show()
Output:
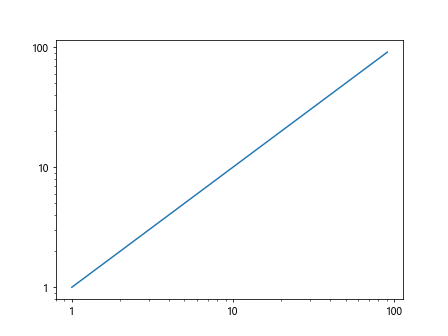
5. Setting Logarithmic Ticks
You can also set logarithmic ticks for the axes using the set_xticks() and set_yticks() methods.
import matplotlib.pyplot as plt
import numpy as np

# Create some data
x = np.arange(1, 100, 10)
y = np.arange(1, 100, 10)

plt.plot(x, y)

# Set logarithmic ticks for the x-axis
plt.xscale('log')
plt.xticks([1, 10, 100], ['1', '10', '100'])

# Set logarithmic ticks for the y-axis
plt.yscale('log')
plt.yticks([1, 10, 100], ['1', '10', '100'])

plt.show()
Output:
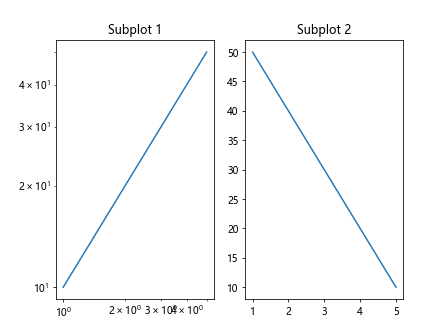
6. Changing the Scale of Multiple Subplots
When working with multiple subplots, you can change the scale of each subplot individually using the axes objects.
import matplotlib.pyplot as plt

# Create some data
x = [1, 2, 3, 4, 5]
y1 = [10, 20, 30, 40, 50]
y2 = [50, 40, 30, 20, 10]

fig, axs = plt.subplots(1, 2)

# Plot on the first subplot
axs[0].plot(x, y1)
axs[0].set_title('Subplot 1')
axs[0].set_xscale('log')
axs[0].set_yscale('log')

# Plot on the second subplot
axs[1].plot(x, y2)
axs[1].set_title('Subplot 2')
axs[1].set_xscale('linear')
axs[1].set_yscale('linear')

plt.show()
Output:
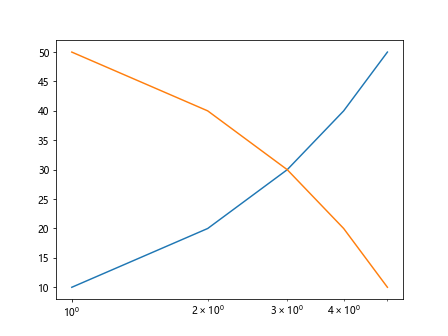
7. Combining Different Scales
You can combine different scales in a single plot by changing the scale of each axis individually.
import matplotlib.pyplot as plt

# Create some data
x = [1, 2, 3, 4, 5]
y1 = [10, 20, 30, 40, 50]
y2 = [50, 40, 30, 20, 10]

plt.plot(x, y1)
plt.plot(x, y2)

# Change the scale of the x-axis to logarithmic
plt.xscale('log')

# Change the scale of the y-axis to linear for the first plot
plt.yscale('linear')

plt.show()
Output:
8. Using Symmetrical Log Scale
The symmetrical log scale is useful for data that includes both positive and negative values.
import matplotlib.pyplot as plt

# Create some data
x = [-100, -50, 0, 50, 100]
y = [-100, -50, 0, 50, 100]

plt.plot(x, y)

# Change the scale of the x-axis to symlog
plt.xscale('symlog')

# Change the scale of the y-axis to symlog
plt.yscale('symlog')

plt.show()
Output:

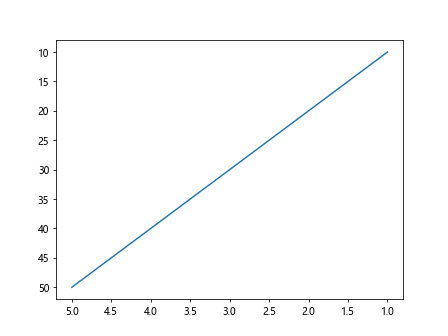
9. Reversing the Scale
You can also reverse the scale of the axes using the set_xticklabels() and set_yticklabels() methods.
import matplotlib.pyplot as plt

# Create some data
x = [1, 2, 3, 4, 5]
y = [10, 20, 30, 40, 50]

plt.plot(x, y)

# Reverse the scale of the x-axis
plt.gca().invert_xaxis()

# Reverse the scale of the y-axis
plt.gca().invert_yaxis()

plt.show()
Output:
10. Using Offset Scale
The offset scale is a scale that automatically adjusts to accommodate large numbers without losing precision.
import matplotlib.pyplot as plt

# Create some data
x = [1000000, 2000000, 3000000, 4000000, 5000000]
y = [1000, 2000, 3000, 4000, 5000]

plt.plot(x, y)

# Change the scale of the x-axis to offset
plt.xscale('offset')

# Change the scale of the y-axis to offset
plt.yscale('offset')

plt.show()
11. Conclusion
In this article, we have explored various ways to change the scale in Matplotlib. By changing the scale of the axes, you can better visualize your data and gain insights into different aspects of the data. Experiment with different scales and find the one that best suits your visualization needs.