How to Change Figure Size in Matplotlib
Matplotlib is a popular Python library used for creating static, animated, and interactive visualizations in Python. One common task when using Matplotlib is changing the figure size to customize the appearance of your plots. In this article, we will explore different ways to change the figure size in Matplotlib.
Using the figure Function
One way to change the figure size in Matplotlib is by using the figure function. This function allows you to create a new figure with a specific size. Here’s an example:
import matplotlib.pyplot as plt

plt.figure(figsize=(8, 6))
plt.plot([1, 2, 3, 4], [1, 4, 9, 16])
plt.show()
Output:
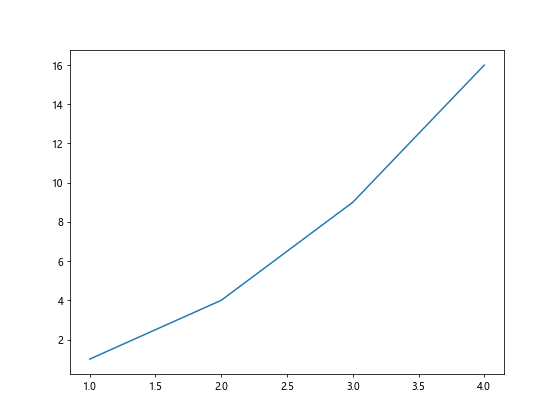
In this example, figsize=(8, 6) sets the figure size to be 8 inches wide and 6 inches tall.
Using the rcParams Configuration
Another way to change the default figure size in Matplotlib is by using the rcParams configuration. This allows you to set the default figure size for all plots in your script. Here’s an example:
import matplotlib.pyplot as plt
import matplotlib

matplotlib.rcParams['figure.figsize'] = (10, 8)

plt.plot([1, 2, 3, 4], [1, 4, 9, 16])
plt.show()
Output:
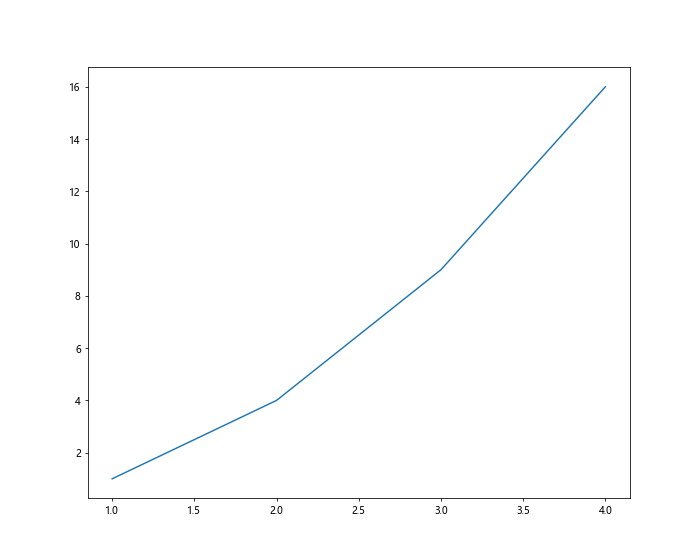
In this example, we set the default figure size to be 10 inches wide and 8 inches tall using rcParams.
Changing Figure Size in Subplots
When working with subplots in Matplotlib, you can also customize the figure size for each subplot. Here’s an example:
import matplotlib.pyplot as plt

fig, axs = plt.subplots(2, 1, figsize=(8, 12))

axs[0].plot([1, 2, 3, 4], [1, 4, 9, 16])
axs[1].plot([1, 2, 3, 4], [1, 8, 27, 64])

plt.show()
Output:
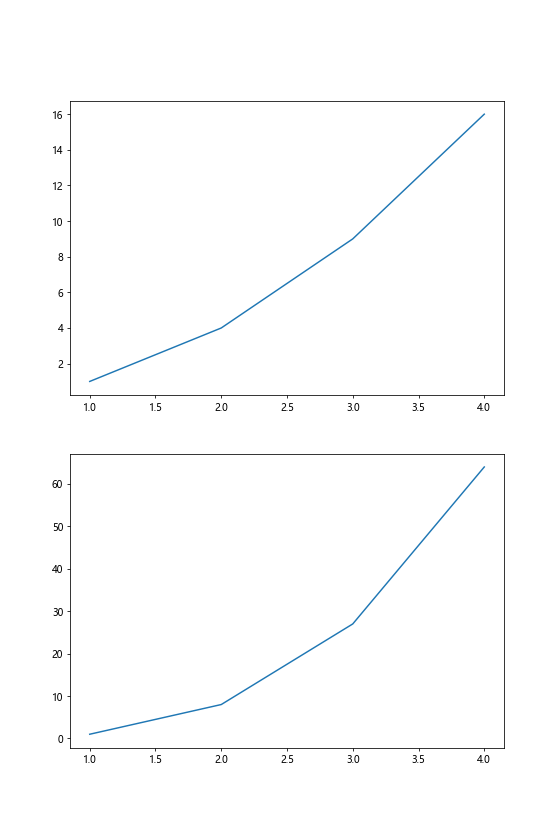
In this example, we create a figure with 2 subplots, each with a custom size of 8 inches wide and 12 inches tall.
Using set_size_inches Method
You can also change the figure size after it has been created using the set_size_inches method. Here’s an example:
import matplotlib.pyplot as plt

fig, ax = plt.subplots()
ax.plot([1, 2, 3, 4], [1, 4, 9, 16])

fig.set_size_inches(6, 4)
plt.show()
Output:
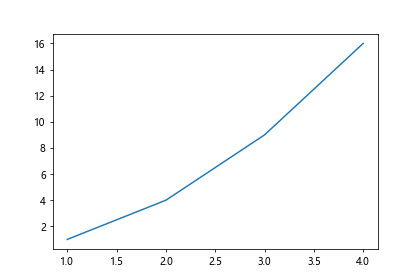
In this example, we first create a figure with the default size and then change it to be 6 inches wide and 4 inches tall using the set_size_inches method.
Customizing Figure Size for Specific Plots
Sometimes you may want to change the figure size for specific plots in your script. You can achieve this by creating a new figure for each plot with a custom size. Here’s an example:
import matplotlib.pyplot as plt

plt.figure(figsize=(6, 4))
plt.plot([1, 2, 3, 4], [1, 4, 9, 16])
plt.show()

plt.figure(figsize=(10, 6))
plt.plot([1, 2, 3, 4], [1, 8, 27, 64])
plt.show()
In this example, we create two separate figures with different sizes for each plot.
Using subplots_adjust to Control Figure Size and Layout
Another way to control the figure size and layout in Matplotlib is by using the subplots_adjust function. This function allows you to adjust the spacing around subplots. Here’s an example:
import matplotlib.pyplot as plt

plt.figure(figsize=(8, 6))
plt.subplots_adjust(left=0.1, right=0.9, top=0.9, bottom=0.1)
plt.plot([1, 2, 3, 4], [1, 4, 9, 16])
plt.show()
Output:
In this example, we set custom margins around the plot using the subplots_adjust function.
Using tight_layout for Automatic Figure Adjustment
Matplotlib provides the tight_layout function, which automatically adjusts subplot parameters to give a specified padding. Here’s an example:
import matplotlib.pyplot as plt

plt.figure(figsize=(8, 6))
plt.tight_layout()
plt.plot([1, 2, 3, 4], [1, 4, 9, 16])
plt.show()
Output:

In this example, the tight_layout function is used to automatically adjust subplot parameters for a figure with a size of 8 inches wide and 6 inches tall.
Using Object-Oriented Interface to Change Figure Size
You can also change the figure size using the object-oriented interface in Matplotlib. Here’s an example:
import matplotlib.pyplot as plt

fig, ax = plt.subplots(figsize=(8, 6))
ax.plot([1, 2, 3, 4], [1, 4, 9, 16])

plt.show()
Output:

In this example, we use the object-oriented approach to create a figure with a size of 8 inches wide and 6 inches tall.
Changing Figure Size in Different Backends
Matplotlib supports different backends for rendering plots, each with its own way of setting the figure size. Here’s an example using the Qt5Agg backend:
import matplotlib
matplotlib.use('Qt5Agg')
import matplotlib.pyplot as plt

plt.figure(figsize=(8, 6))
plt.plot([1, 2, 3, 4], [1, 4, 9, 16])
plt.show()
In this example, we set the figure size for a plot using the Qt5Agg backend.
Conclusion
In this article, we have explored various ways to change the figure size in Matplotlib. From using the figure function to adjusting figure size for subplots and specific plots, there are several options available for customizing the appearance of your plots. By understanding these techniques, you can create visually appealing visualizations with Matplotlib.