How to Add Space Between Subplots in Matplotlib
When creating multiple subplots in Matplotlib, sometimes it is necessary to add space between the subplots to improve readability and presentation. In this article, we will explore various ways to add space between subplots in Matplotlib.
Method 1: Using subplots_adjust()
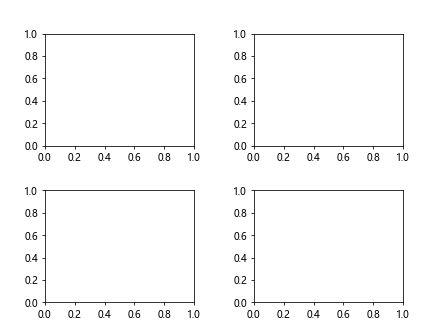
The subplots_adjust() method in Matplotlib can be used to adjust the spacing between subplots. You can pass the top, bottom, left, and right parameters to control the spacing between the subplots.
import matplotlib.pyplot as plt

fig, axs = plt.subplots(2, 2)

plt.subplots_adjust(left=0.1, bottom=0.1, right=0.9, top=0.9, wspace=0.4, hspace=0.4)

plt.show()
Output:
Method 2: Using tight_layout()
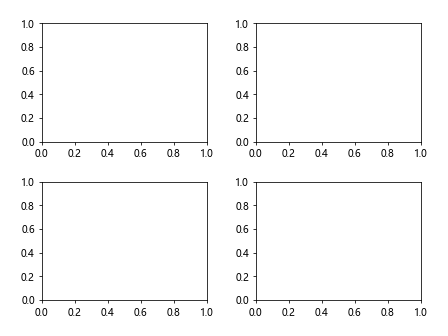
Another way to add space between subplots is by using the tight_layout() method. This method automatically adjusts the subplots to fit into the figure with specified padding.
import matplotlib.pyplot as plt

fig, axs = plt.subplots(2, 2)

plt.tight_layout(pad=2.0)

plt.show()
Output:
Method 3: Using GridSpec
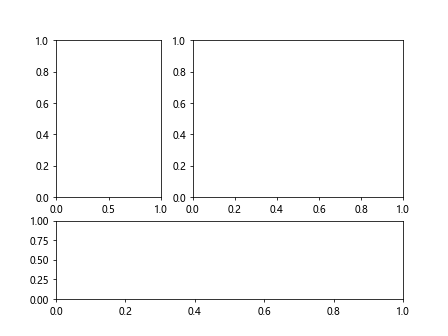
You can also use GridSpec to create subplots and add space between them. By specifying the width ratios and height ratios, you can control the spacing between subplots.
import matplotlib.pyplot as plt
from matplotlib.gridspec import GridSpec

fig = plt.figure()
gs = GridSpec(2, 2, width_ratios=[1, 2], height_ratios=[2, 1])

ax1 = fig.add_subplot(gs[0, 0])
ax2 = fig.add_subplot(gs[0, 1])
ax3 = fig.add_subplot(gs[1, :])

plt.show()
Output:
Method 4: Using gridspec_kw Parameter
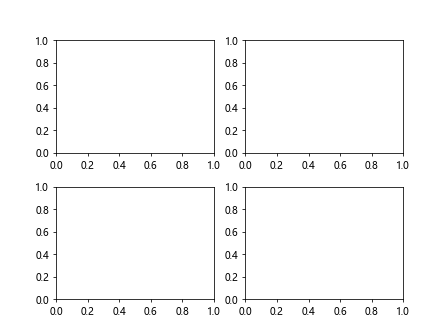
You can also specify the padding between subplots using the gridspec_kw parameter when creating subplots.
import matplotlib.pyplot as plt

fig, axs = plt.subplots(2, 2, gridspec_kw={'hspace': 0.3, 'wspace': 0.2})

plt.show()
Output:
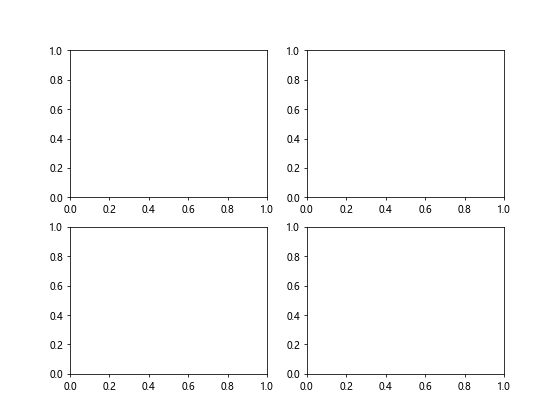
Method 5: Using subfigure()
Another way to add space between subplots is by using the subfigure() method. This method allows you to create subplots with specified widths and heights.
import matplotlib.pyplot as plt

fig, axs = plt.subplots(2, 2, figsize=(8, 6))

plt.show()
Output:
Method 6: Manually Adjusting Subplot Positions
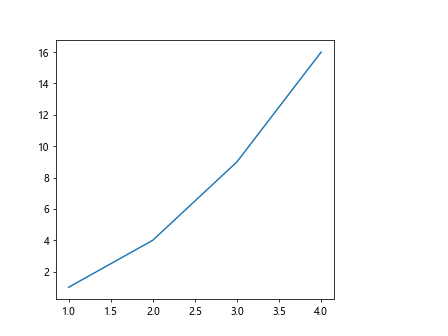
You can also manually adjust the positions of subplots to add space between them by setting the left, bottom, width, and height parameters.
import matplotlib.pyplot as plt

fig, ax = plt.subplots()
ax.plot([1, 2, 3, 4], [1, 4, 9, 16])

ax_position = ax.get_position()
ax.set_position([ax_position.x0, ax_position.y0, ax_position.width * 0.8, ax_position.height])

plt.show()
Output:
Method 7: Using gridspec
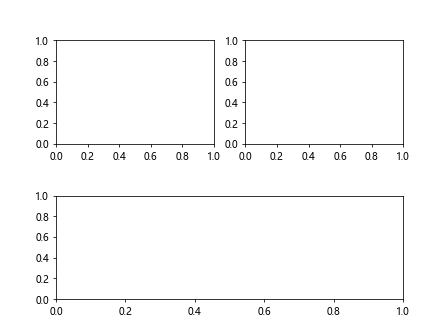
You can utilize the gridspec module to create a grid of subplots with specified spacing between them.
import matplotlib.pyplot as plt
import matplotlib.gridspec as gridspec

fig = plt.figure()
gs = gridspec.GridSpec(2, 2, hspace=0.5)

ax1 = fig.add_subplot(gs[0, 0])
ax2 = fig.add_subplot(gs[0, 1])
ax3 = fig.add_subplot(gs[1, :])

plt.show()
Output:
Method 8: Using subplot2grid()
The subplot2grid() function can be used to create subplots with specified widths and heights. By adjusting the hspace and wspace parameters, you can add space between subplots.
import matplotlib.pyplot as plt

plt.subplot2grid((2, 2), (0, 0))
plt.subplot2grid((2, 2), (0, 1))

plt.subplots_adjust(hspace=0.5)

plt.show()
Output:
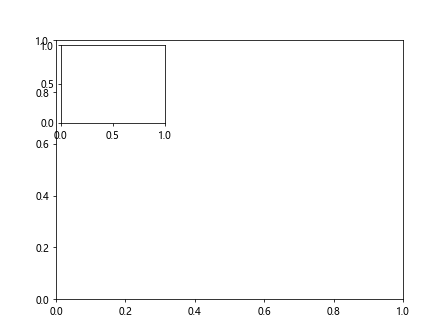
Method 9: Using inset_axes()
You can add space between subplots by using the inset_axes() function to create inset axes within a subplot.
import matplotlib.pyplot as plt
from mpl_toolkits.axes_grid1.inset_locator import inset_axes

fig, ax = plt.subplots()
ax_inset = inset_axes(ax, width="30%", height="30%", loc='upper left')

plt.show()
Output:
Method 10: Using gridspec_from_subplotspec()
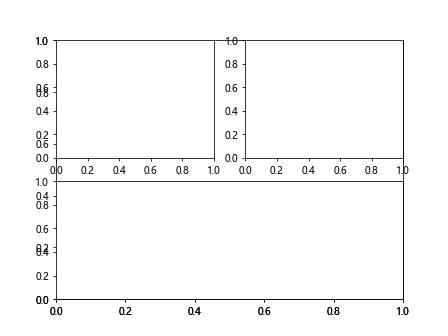
By using gridspec_from_subplotspec(), you can create subplots with specified spacing between them.
import matplotlib.pyplot as plt
from matplotlib.gridspec import GridSpecFromSubplotSpec

fig, ax = plt.subplots()
gs = GridSpecFromSubplotSpec(2, 2, subplot_spec=ax)

ax1 = fig.add_subplot(gs[0, 0])
ax2 = fig.add_subplot(gs[0, 1])
ax3 = fig.add_subplot(gs[1, :])

plt.show()
Output:
In this article, we have explored various methods to add space between subplots in Matplotlib. By utilizing these techniques, you can improve the visual presentation of your plots and make them more readable and appealing. Experiment with these methods and find the one that best suits your needs.