How to Add Text in Matplotlib
Matplotlib is a powerful plotting library for Python that allows users to create various types of visualizations, from simple line plots to complex 3D plots. One common use case in data visualization is to add text to the plots to provide additional information or annotations. In this article, we will explore different ways to add text in Matplotlib.
1. Adding Text with plt.text
The plt.text function in Matplotlib allows us to add text at any position on the plot. The basic syntax for plt.text is:
import matplotlib.pyplot as plt

plt.text(x, y, 'Text to display', fontsize=12, color='red')
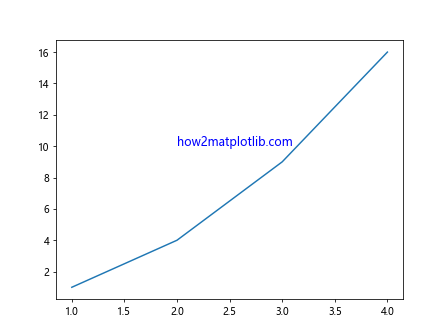
Here is an example of adding text at a specific position on a plot:
import matplotlib.pyplot as plt

plt.figure()
plt.plot([1, 2, 3, 4], [1, 4, 9, 16])
plt.text(2, 10, 'how2matplotlib.com', fontsize=12, color='blue')
plt.show()
Output:
2. Adding Text with ax.text
In addition to plt.text, we can also add text using the text method of the Axes object. This approach is useful when working with multiple subplots. The syntax for ax.text is:
import matplotlib.pyplot as plt

fig, ax = plt.subplots()
ax.text(x, y, 'Text to display', fontsize=12, color='green')
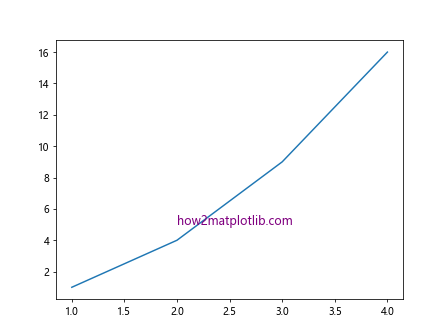
Here is an example of adding text using ax.text:
import matplotlib.pyplot as plt

fig, ax = plt.subplots()
ax.plot([1, 2, 3, 4], [1, 4, 9, 16])
ax.text(2, 5, 'how2matplotlib.com', fontsize=12, color='purple')
plt.show()
Output:
3. Adding Text with Annotations
In Matplotlib, annotations are a powerful way to add text with arrows pointing to specific locations on the plot. The annotate function is used for this purpose. The basic syntax for annotate is:
import matplotlib.pyplot as plt

plt.annotate('Annotation text', xy=(x, y), xytext=(x_text, y_text),
             arrowprops=dict(facecolor='black', shrink=0.05))
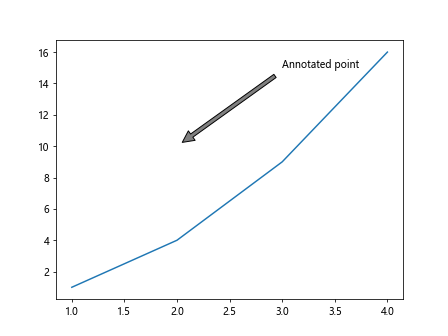
Here is an example of adding an annotation to a plot:
import matplotlib.pyplot as plt

plt.figure()
plt.plot([1, 2, 3, 4], [1, 4, 9, 16])
plt.annotate('Annotated point', xy=(2, 10), xytext=(3, 15),
             arrowprops=dict(facecolor='gray', shrink=0.05))
plt.show()
Output:
4. Adding Text with plt.figtext
In Matplotlib, the plt.figtext function can be used to add text at a specific position relative to the figure instead of the plot. The basic syntax for plt.figtext is:
import matplotlib.pyplot as plt

plt.figtext(x, y, 'Text to display', fontsize=12, color='orange')
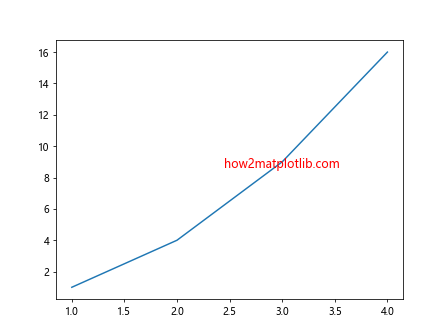
Here is an example of adding text using plt.figtext:
import matplotlib.pyplot as plt

plt.figure()
plt.plot([1, 2, 3, 4], [1, 4, 9, 16])
plt.figtext(0.5, 0.5, 'how2matplotlib.com', fontsize=12, color='red')
plt.show()
Output:
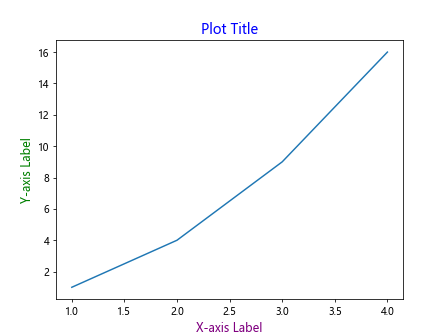
5. Adding Text with plt.title and plt.xlabel/plt.ylabel
Another way to add text to a plot in Matplotlib is to use the plt.title, plt.xlabel, and plt.ylabel functions to add a title, x-axis label, and y-axis label respectively. The basic syntax for these functions is:
import matplotlib.pyplot as plt

plt.plot([1, 2, 3, 4], [1, 4, 9, 16])
plt.title('Plot Title', fontsize=14, color='blue')
plt.xlabel('X-axis Label', fontsize=12, color='purple')
plt.ylabel('Y-axis Label', fontsize=12, color='green')
plt.show()
Output:
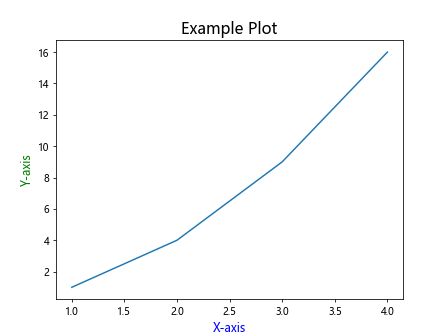
Here is an example of adding a title and axis labels to a plot:
import matplotlib.pyplot as plt

plt.plot([1, 2, 3, 4], [1, 4, 9, 16])
plt.title('Example Plot', fontsize=16, color='black')
plt.xlabel('X-axis', fontsize=12, color='blue')
plt.ylabel('Y-axis', fontsize=12, color='green')
plt.show()
Output:
6. Adding Text with plt.text Inside a Loop
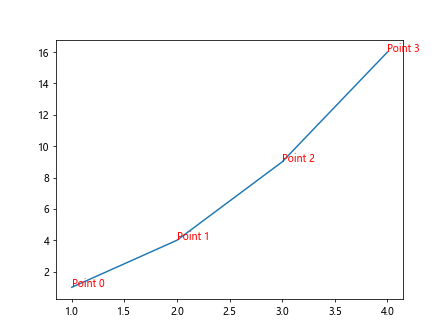
If you want to add multiple text elements to a plot, you can do so inside a loop. This allows you to dynamically add text based on certain conditions or data. Here is an example of adding text inside a loop:
import matplotlib.pyplot as plt

x = [1, 2, 3, 4]
y = [1, 4, 9, 16]

plt.figure()
plt.plot(x, y)

for i, (xi, yi) in enumerate(zip(x, y)):
    plt.text(xi, yi, f'Point {i}', fontsize=10, color='red')

plt.show()
Output:
7. Adding Text with Math Expressions
Matplotlib allows users to render text with mathematical expressions using LaTeX. This is useful for displaying mathematical symbols and equations on plots. To render text with math expressions, you can use the usetex=True parameter. Here is an example:
import matplotlib.pyplot as plt

plt.figure()
plt.text(0.5, 0.5, r'$\alpha^2 + \beta^2 + \gamma^2 = \delta^2$', fontsize=14, color='blue', usetex=True)
plt.show()
8. Adding Rotated Text
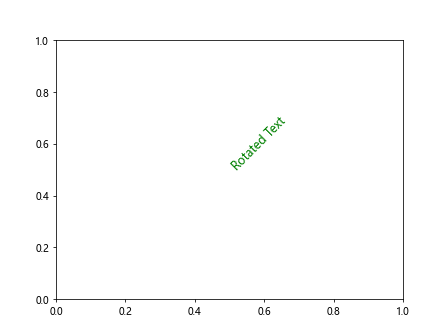
In some cases, you may want to add rotated text to a plot for better readability or aesthetics. Matplotlib allows users to rotate text using the rotation parameter. Here is an example of adding rotated text:
import matplotlib.pyplot as plt

plt.figure()
plt.text(0.5, 0.5, 'Rotated Text', fontsize=12, color='green', rotation=45)
plt.show()
Output:
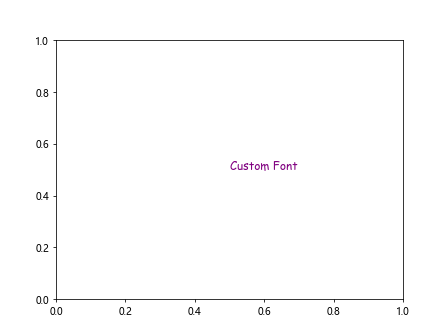
9. Adding Text with Custom Fonts
Matplotlib supports the use of custom fonts for text rendering. You can specify a custom font using the fontname parameter. Here is an example of adding text with a custom font:
import matplotlib.pyplot as plt

plt.figure()
plt.text(0.5, 0.5, 'Custom Font', fontsize=12, fontname='Comic Sans MS', color='purple')
plt.show()
Output:
10. Adding Text with Background Color
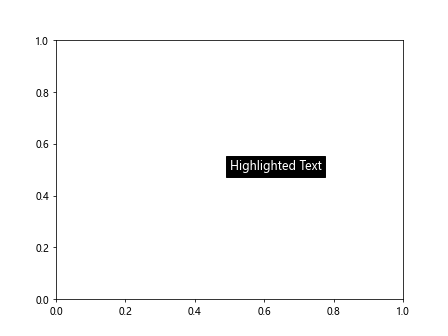
If you want to highlight text on a plot, you can add a background color to the text using the bbox parameter. Here is an example of adding text with a background color:
import matplotlib.pyplot as plt

plt.figure()
plt.text(0.5, 0.5, 'Highlighted Text', fontsize=12, color='white', backgroundcolor='black')
plt.show()
Output:
In this article, we have explored various ways to add text to plots in Matplotlib. By using functions like plt.text, ax.text, annotate, plt.figtext, plt.title, plt.xlabel, and plt.ylabel, you can customize text elements to enhance the interpretability and aesthetics of your plots. Experiment with different font styles, colors, rotations, and background colors to create visually appealing and informative visualizations.