Subplot plt
In this article, we will explore how to create subplots using the subplot function in matplotlib. Subplots are useful when we want to display multiple plots within the same figure. We can use subplots to compare different datasets, visualize different aspects of the same data, or present related visualizations in a single figure.
Let’s dive into how we can create subplots using plt.subplot in matplotlib.
Basic Subplots
We can create a simple grid of subplots using the subplot function. The function takes three arguments: the number of rows, the number of columns, and the index of the subplot we want to create. The index starts at 1 and increases from left to right, top to bottom.
import matplotlib.pyplot as plt

plt.figure(figsize=(10, 5))

plt.subplot(2, 2, 1)
plt.plot([1, 2, 3, 4], [1, 4, 9, 16])
plt.title('Subplot 1')

plt.subplot(2, 2, 2)
plt.plot([1, 2, 3, 4], [1, 2, 3, 4])
plt.title('Subplot 2')

plt.subplot(2, 2, 3)
plt.plot([1, 2, 3, 4], [4, 3, 2, 1])
plt.title('Subplot 3')

plt.subplot(2, 2, 4)
plt.plot([1, 2, 3, 4], [1, 8, 27, 64])
plt.title('Subplot 4')

plt.tight_layout()
plt.show()
Output:
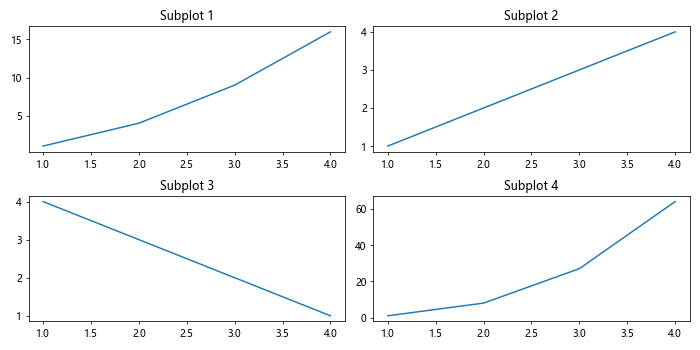
In the code above, we create a 2×2 grid of subplots and plot different datasets on each subplot. We use plt.subplot to specify the position of each subplot in the grid.
Subplot Grids
We can also create subplots using a grid of subplots by using the subplots function. This function returns a figure and a 2D array of axes objects, which allows us to easily access and plot on individual subplots.
import matplotlib.pyplot as plt

fig, axs = plt.subplots(2, 2, figsize=(10, 5))

axs[0, 0].plot([1, 2, 3, 4], [1, 4, 9, 16])
axs[0, 0].set_title('Subplot 1')

axs[0, 1].plot([1, 2, 3, 4], [1, 2, 3, 4])
axs[0, 1].set_title('Subplot 2')

axs[1, 0].plot([1, 2, 3, 4], [4, 3, 2, 1])
axs[1, 0].set_title('Subplot 3')

axs[1, 1].plot([1, 2, 3, 4], [1, 8, 27, 64])
axs[1, 1].set_title('Subplot 4')

plt.tight_layout()
plt.show()
Output:
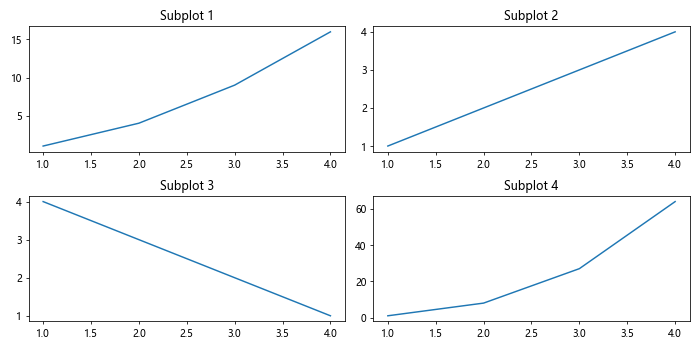
In this example, we use the subplots function to create a 2×2 grid of subplots. We then access each subplot using the 2D array of axes objects returned by the function and plot data on individual subplots.
Subplot Spacing
We can adjust the spacing between subplots using the hspace and wspace parameters in the subplots function. These parameters control the height and width spacing between subplots, respectively.
import matplotlib.pyplot as plt

fig, axs = plt.subplots(2, 2, figsize=(10, 5), hspace=0.3, wspace=0.2)

axs[0, 0].plot([1, 2, 3, 4], [1, 4, 9, 16])
axs[0, 0].set_title('Subplot 1')

axs[0, 1].plot([1, 2, 3, 4], [1, 2, 3, 4])
axs[0, 1].set_title('Subplot 2')

axs[1, 0].plot([1, 2, 3, 4], [4, 3, 2, 1])
axs[1, 0].set_title('Subplot 3')

axs[1, 1].plot([1, 2, 3, 4], [1, 8, 27, 64])
axs[1, 1].set_title('Subplot 4')

plt.show()
By setting hspace=0.3 and wspace=0.2, we increase the vertical spacing between subplots to 30% of the figure height and the horizontal spacing between subplots to 20% of the figure width.
Subplot Sizes
We can also adjust the size of individual subplots within a grid using the gridspec module in matplotlib. This allows us to create subplots of different sizes and shapes within the same figure.
import matplotlib.pyplot as plt
import matplotlib.gridspec as gridspec

fig = plt.figure(figsize=(10, 5))

gs = gridspec.GridSpec(2, 2, width_ratios=[2, 1], height_ratios=[1, 2])

ax1 = plt.subplot(gs[0])
ax1.plot([1, 2, 3, 4], [1, 4, 9, 16])
ax1.set_title('Subplot 1')

ax2 = plt.subplot(gs[1])
ax2.plot([1, 2, 3, 4], [1, 2, 3, 4])
ax2.set_title('Subplot 2')

ax3 = plt.subplot(gs[2])
ax3.plot([1, 2, 3, 4], [4, 3, 2, 1])
ax3.set_title('Subplot 3')

ax4 = plt.subplot(gs[3])
ax4.plot([1, 2, 3, 4], [1, 8, 27, 64])
ax4.set_title('Subplot 4')

plt.tight_layout()
plt.show()
Output:
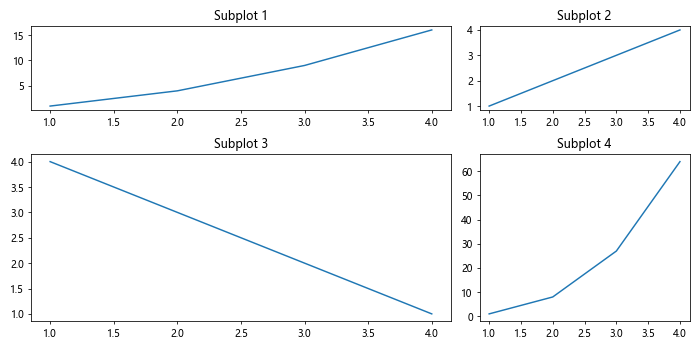
In this example, we use gridspec.GridSpec to create a grid of subplots with different sizes. The width_ratios and height_ratios parameters allow us to specify the relative widths and heights of the subplots.
Subplot Styles
We can customize the styles of individual subplots by accessing the Axes objects returned by the subplot function. This allows us to change the colors, markers, and other properties of each subplot.
import matplotlib.pyplot as plt

plt.figure(figsize=(10, 5))

ax1 = plt.subplot(1, 2, 1)
ax1.plot([1, 2, 3, 4], [1, 4, 9, 16], color='red', linestyle='--', marker='o')
ax1.set_title('Subplot 1')

ax2 = plt.subplot(1, 2, 2)
ax2.plot([1, 2, 3, 4], [1, 2, 3, 4], color='blue', linestyle='-', marker='s')
ax2.set_title('Subplot 2')

plt.tight_layout()
plt.show()
Output:
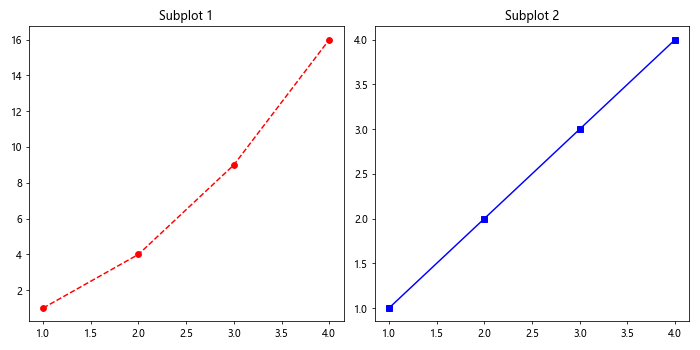
In this example, we customize the styles of the subplots by setting the color, linestyle, and marker properties of each subplot using the plot function on the Axes objects.
Subplot Annotations
We can add annotations to individual subplots to provide additional information or context. Annotations can include text labels, arrows, and shapes that highlight specific points or trends in the data.
import matplotlib.pyplot as plt

plt.figure(figsize=(10, 5))

ax1 = plt.subplot(1, 2, 1)
ax1.plot([1, 2, 3, 4], [1, 4, 9, 16])
ax1.annotate('Max Value', xy=(4, 16), xytext=(3, 20),
             arrowprops=dict(facecolor='black', shrink=0.05))
ax1.set_title('Subplot 1')

ax2 = plt.subplot(1, 2, 2)
ax2.plot([1, 2, 3, 4], [1, 2, 3, 4])
ax2.annotate('Min Value', xy=(4, 4), xytext=(3, 2),
             arrowprops=dict(facecolor='black', shrink=0.05))
ax2.set_title('Subplot 2')

plt.tight_layout()
plt.show()
Output:
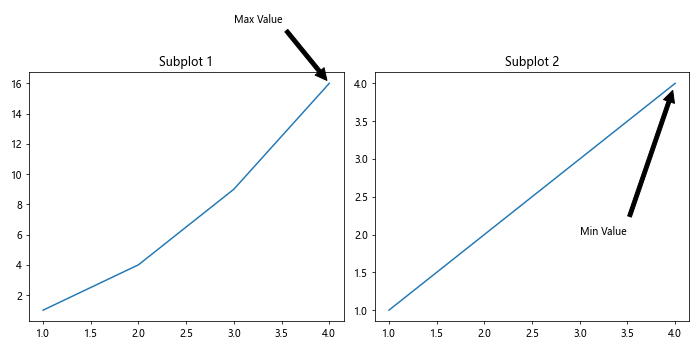
In this example, we add annotations to the subplots by using the annotate method on the Axes objects. The annotations include text labels and arrows that point to specific points in the datasets.
Subplot Legends
We can add legends to subplots to provide information about the different elements within the plot, such as lines, markers, and colors. Legends are useful when we have multiple datasets or want to distinguish between different categories.
import matplotlib.pyplot as plt

plt.figure(figsize=(10, 5))

ax1 = plt.subplot(1, 2, 1)
ax1.plot([1, 2, 3, 4], [1, 4, 9, 16], label='Data A')
ax1.plot([1, 2, 3, 4], [1, 2, 3, 4], label='Data B')
ax1.legend()
ax1.set_title('Subplot 1')

ax2 = plt.subplot(1, 2, 2)
ax2.plot([1, 2, 3, 4], [1, 2, 3, 4], label='Data C')
ax2.plot([1, 2, 3, 4], [4, 3, 2, 1], label='Data D')
ax2.legend()
ax2.set_title('Subplot 2')

plt.tight_layout()
plt.show()
Output:
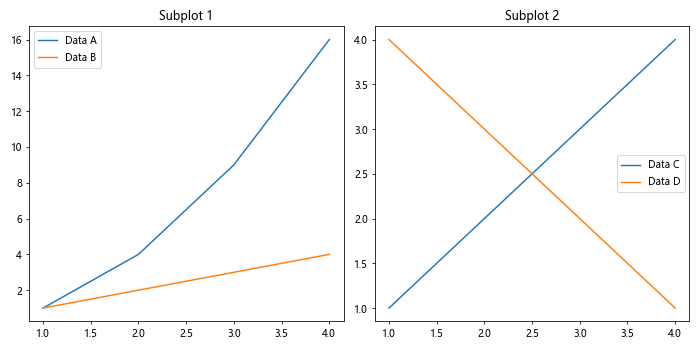
In this code snippet, we add legends to the subplots using the legend method on the Axes objects. The legends provide key information about the different datasets plotted on each subplot.
Subplot Colorbars
We can add colorbars to subplots to represent the color mapping of specific elements within the plot, such as heatmaps, contour plots, or scatter plots. Colorbars provide a visual guide to the color scale used in the plot.
import matplotlib.pyplot as plt
import numpy as np

plt.figure(figsize=(10, 5))

ax1 = plt.subplot(1, 2, 1)
data1 = np.random.rand(10, 10)
heatmap1 = ax1.imshow(data1, cmap='viridis')
plt.colorbar(heatmap1, ax=ax1)
ax1.set_title('Subplot 1')

ax2 = plt.subplot(1, 2, 2)
data2 = np.random.rand(10, 10)
heatmap2 = ax2.imshow(data2, cmap='plasma')
plt.colorbar(heatmap2, ax=ax2)
ax2.set_title('Subplot 2')

plt.tight_layout()
plt.show()
Output:
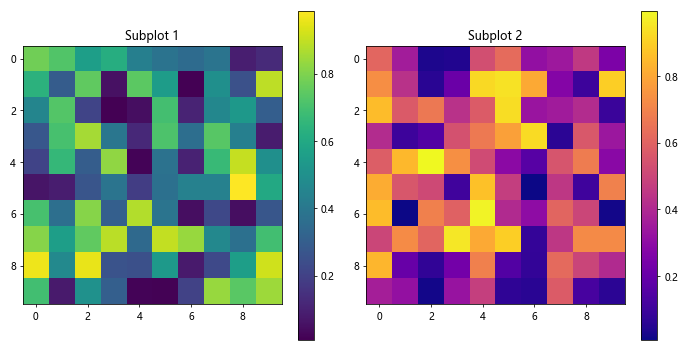
In this example, we create subplots with colorbars using the imshow function to display 2D arrays as heatmaps. We add colorbars to the subplots using the colorbar function, which automatically adjusts to the color mapping of the plot.
Subplot Titles and Labels
We can add titles and axis labels to individual subplots to provide context and information about the plotted data. Titles describe the content of the subplot, while axis labels indicate the data dimensions and scale.
import matplotlib.pyplot as plt

plt.figure(figsize=(10, 5))

ax1 = plt.subplot(1, 2, 1)
ax1.plot([1, 2, 3, 4], [1, 4, 9, 16])
ax1.set_title('Subplot 1')
ax1.set_xlabel('X-axis')
ax1.set_ylabel('Y-axis')

ax2 = plt.subplot(1, 2, 2)
ax2.plot([1, 2, 3, 4], [1, 2, 3, 4])
ax2.set_title('Subplot 2')
ax2.set_xlabel('X-axis')
ax2.set_ylabel('Y-axis')

plt.tight_layout()
plt.show()
Output:
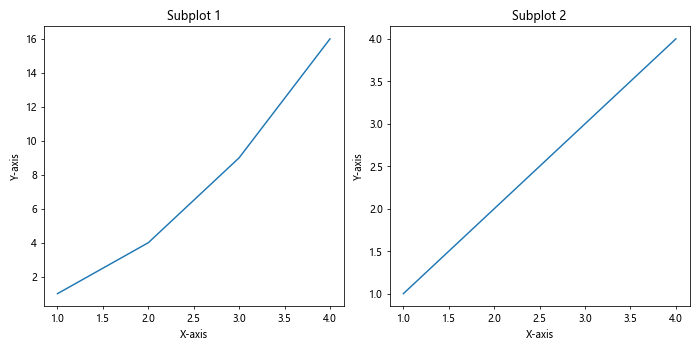
In this code snippet, we add titles, x-axis labels, and y-axis labels to the subplots using the set_title, set_xlabel, and set_ylabel methods on the Axes objects. These annotations provide context and information about the plotted data.
Conclusion
In this article, we explored how to create subplots using the subplot function in matplotlib. We learned how to create basic subplots, subplot grids, adjust spacing and sizes of subplots, customize subplot styles, add annotations, legends, colorbars, titles, and labels to subplots.
Subplots are a powerful tool for visualizing and comparing multiple datasets within the same figure. By creating subplots, we can present related visualizations in a clear and organized manner, making it easier to analyze and interpret the data.
I hope this article has been helpful in understanding how to work with subplots in matplotlib. Experiment with the examples provided and explore the various customization options available for creating informative and visually appealing subplots in your plots.