Subplot Spacing in Matplotlib
When creating subplots in Matplotlib, it is important to consider the spacing between the subplots to ensure they are visually appealing and easy to read. In this article, we will explore the various ways to adjust the spacing between subplots in Matplotlib.
Adjusting Horizontal Spacing
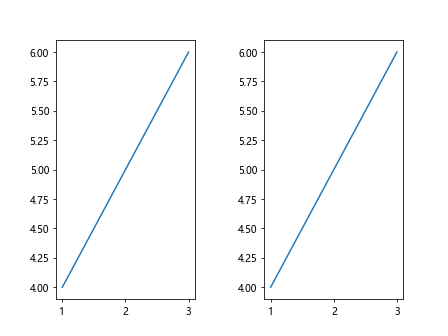
Example 1: Adjusting Horizontal Spacing
import matplotlib.pyplot as plt

fig, axs = plt.subplots(1, 2)
fig.subplots_adjust(wspace=0.5)

axs[0].plot([1, 2, 3], [4, 5, 6])
axs[1].plot([1, 2, 3], [4, 5, 6])
plt.show()
Output:
Adjusting Vertical Spacing
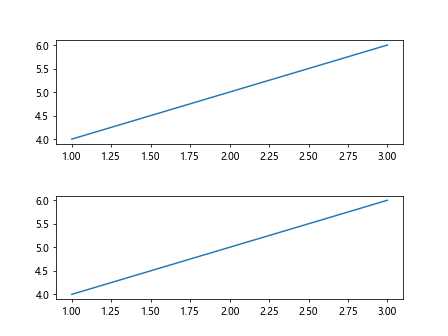
Example 2: Adjusting Vertical Spacing
import matplotlib.pyplot as plt

fig, axs = plt.subplots(2, 1)
fig.subplots_adjust(hspace=0.5)

axs[0].plot([1, 2, 3], [4, 5, 6])
axs[1].plot([1, 2, 3], [4, 5, 6])
plt.show()
Output:
Adjusting Overall Spacing
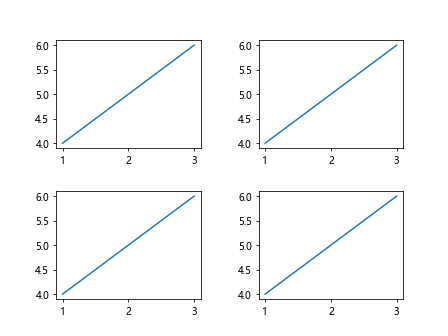
Example 3: Adjusting Overall Spacing
import matplotlib.pyplot as plt

fig, axs = plt.subplots(2, 2)
fig.subplots_adjust(wspace=0.4, hspace=0.4)

axs[0, 0].plot([1, 2, 3], [4, 5, 6])
axs[0, 1].plot([1, 2, 3], [4, 5, 6])
axs[1, 0].plot([1, 2, 3], [4, 5, 6])
axs[1, 1].plot([1, 2, 3], [4, 5, 6])
plt.show()
Output:
Fine-Tuning Spacing
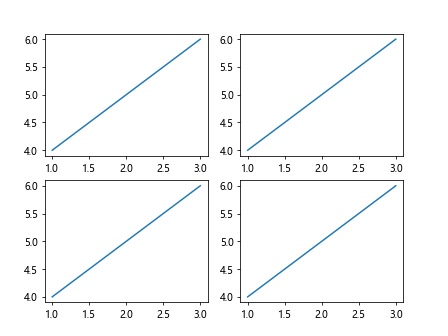
Example 4: Fine-Tuning Spacing
import matplotlib.pyplot as plt

fig, axs = plt.subplots(2, 2)
fig.subplots_adjust(left=0.1, right=0.9, bottom=0.1, top=0.9)

axs[0, 0].plot([1, 2, 3], [4, 5, 6])
axs[0, 1].plot([1, 2, 3], [4, 5, 6])
axs[1, 0].plot([1, 2, 3], [4, 5, 6])
axs[1, 1].plot([1, 2, 3], [4, 5, 6])
plt.show()
Output:
Using GridSpec for Spacing
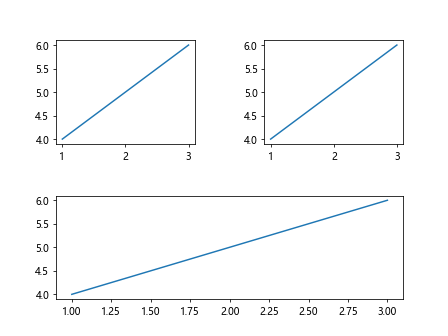
Example 5: Using GridSpec for Spacing
import matplotlib.pyplot as plt
from matplotlib.gridspec import GridSpec

fig = plt.figure()
gs = GridSpec(2, 2, hspace=0.5, wspace=0.5)

ax1 = fig.add_subplot(gs[0, 0])
ax2 = fig.add_subplot(gs[0, 1])
ax3 = fig.add_subplot(gs[1, :])

ax1.plot([1, 2, 3], [4, 5, 6])
ax2.plot([1, 2, 3], [4, 5, 6])
ax3.plot([1, 2, 3], [4, 5, 6])

plt.show()
Output:
Adjusting Subplot Sizes
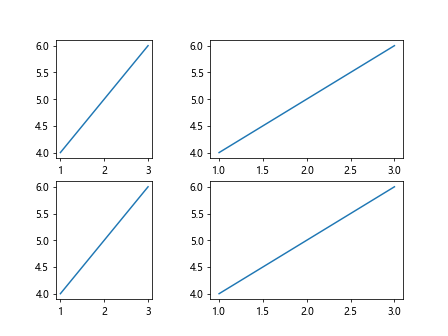
Example 6: Adjusting Subplot Sizes
import matplotlib.pyplot as plt

fig, axs = plt.subplots(2, 2, gridspec_kw={'width_ratios': [1, 2]})
fig.subplots_adjust(wspace=0.4)

axs[0, 0].plot([1, 2, 3], [4, 5, 6])
axs[0, 1].plot([1, 2, 3], [4, 5, 6])
axs[1, 0].plot([1, 2, 3], [4, 5, 6])
axs[1, 1].plot([1, 2, 3], [4, 5, 6])

plt.show()
Output:
Fine-Tuning Subplot Sizes
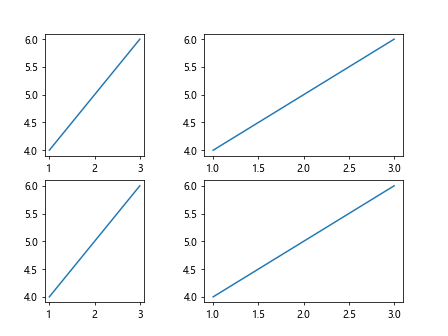
Example 7: Fine-Tuning Subplot Sizes
import matplotlib.pyplot as plt

fig, axs = plt.subplots(2, 2, gridspec_kw={'width_ratios': [1, 2]})
fig.subplots_adjust(left=0.1, right=0.9, bottom=0.1, top=0.9, wspace=0.4)

axs[0, 0].plot([1, 2, 3], [4, 5, 6])
axs[0, 1].plot([1, 2, 3], [4, 5, 6])
axs[1, 0].plot([1, 2, 3], [4, 5, 6])
axs[1, 1].plot([1, 2, 3], [4, 5, 6])

plt.show()
Output:
Adjusting Subplot Size Ratios
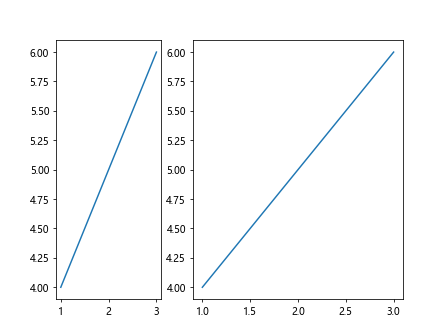
Example 8: Adjusting Subplot Size Ratios
import matplotlib.pyplot as plt

fig, axs = plt.subplots(1, 2, gridspec_kw={'width_ratios': [1, 2]})

axs[0].plot([1, 2, 3], [4, 5, 6])
axs[1].plot([1, 2, 3], [4, 5, 6])

plt.show()
Output:
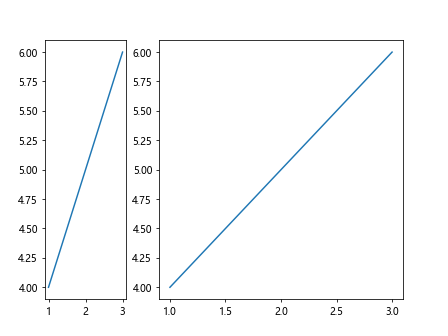
Fine-Tuning Subplot Size Ratios
Example 9: Fine-Tuning Subplot Size Ratios
import matplotlib.pyplot as plt

fig, axs = plt.subplots(1, 2, gridspec_kw={'width_ratios': [1, 3]})
fig.subplots_adjust(left=0.1, right=0.9)

axs[0].plot([1, 2, 3], [4, 5, 6])
axs[1].plot([1, 2, 3], [4, 5, 6])

plt.show()
Output:
Adjusting Aspect Ratios
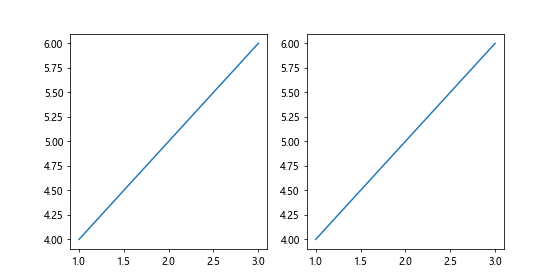
Example 10: Adjusting Aspect Ratios
import matplotlib.pyplot as plt

fig, axs = plt.subplots(1, 2, figsize=(8, 4))

axs[0].plot([1, 2, 3], [4, 5, 6])
axs[1].plot([1, 2, 3], [4, 5, 6])

plt.show()
Output:
In this article, we have explored various ways to adjust the spacing between subplots in Matplotlib, as well as fine-tuning the sizes and aspect ratios of subplots. By carefully adjusting these parameters, you can create visually appealing and well-organized plots for your data visualization needs. Experiment with the examples provided to find the spacing and layout that works best for your specific requirements.