Introduction to matplotlib.cm.get_cmap
In the world of data visualization, choosing the right colors is crucial to effectively conveying the message of your data. Matplotlib is a popular Python library for creating static, animated, and interactive visualizations in Python. One useful function in Matplotlib is matplotlib.cm.get_cmap, which allows users to retrieve colormaps for their plots. In this article, we will explore how to use matplotlib.cm.get_cmap to enhance the aesthetics of our visualizations.
Basic Usage
The matplotlib.cm.get_cmap function can be used to retrieve a colormap object by name. Colormaps are color maps, ranging from a set of colors, which are typically used to represent data in visualizations. Here is a basic example of how to use matplotlib.cm.get_cmap:
import matplotlib.pyplot as plt
import numpy as np

# Generate some random data
x = np.linspace(0, 10, 100)
y = np.sin(x)

# Get the 'viridis' colormap
cmap = plt.get_cmap('viridis')

# Plot the data with the colormap
plt.scatter(x, y, c=y, cmap=cmap)
plt.colorbar()
plt.show()
Output:
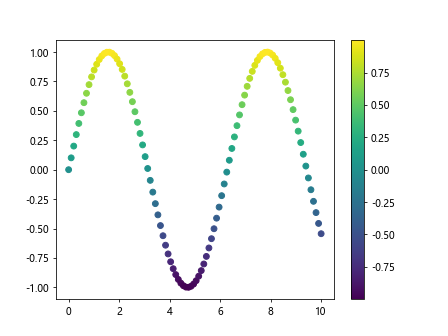
In this example, we retrieve the ‘viridis’ colormap using plt.get_cmap and apply it to a scatter plot using the cmap parameter.
Specifying Colormap Range
You can also specify the range of values for the colormap using the vmin and vmax parameters. This can be useful for emphasizing certain data points in your visualizations. Here is an example:
import matplotlib.pyplot as plt
import numpy as np

# Generate random data
data = np.random.rand(10)

# Get the 'plasma' colormap
cmap = plt.get_cmap('plasma')

# Plot the data with specified range
plt.scatter(range(10), range(10), c=data, cmap=cmap, vmin=0.2, vmax=0.8)
plt.colorbar()
plt.show()
Output:
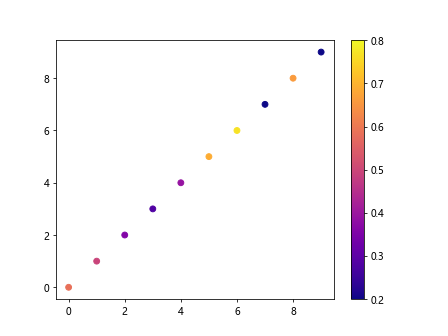
In this example, we use the ‘plasma’ colormap and specify that we only want to use the colors between 0.2 and 0.8 in the colormap.
Using Colormap Objects
The colormap object returned by matplotlib.cm.get_cmap can also be used to map data values to colors. This can be useful for customizing the color mapping in your visualizations. Here is an example:
import matplotlib.pyplot as plt
import numpy as np

# Generate random data
data = np.random.rand(10)

# Get the 'hot' colormap
cmap = plt.get_cmap('hot')

# Create a colormap object
norm = plt.Normalize(min(data), max(data))

# Plot the data with custom colormap
plt.bar(range(10), data, color=cmap(norm(data)))
plt.show()
Output:
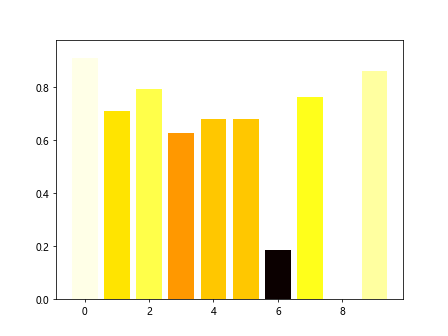
In this example, we create a colormap object using plt.Normalize and then use it to map the data values to colors in a bar plot.
Reversing Colormap
You can also reverse the colormap using the reversed parameter. This can be useful for highlighting different aspects of your data. Here is an example:
import matplotlib.pyplot as plt
import numpy as np

# Generate random data
data = np.random.rand(10)

# Get the reversed 'viridis' colormap
cmap = plt.get_cmap('viridis_r')

# Plot the data with reversed colormap
plt.bar(range(10), data, color=cmap(data))
plt.show()
Output:
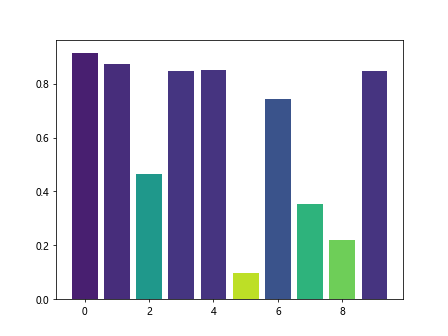
In this example, we retrieve the reversed ‘viridis’ colormap using ‘viridis_r’ and use it in a bar plot.
Combining Colormaps
Another useful feature of matplotlib.cm.get_cmap is the ability to combine multiple colormaps. This can be done using the ListedColormap function. Here is an example:
from matplotlib.colors import ListedColormap
import matplotlib.pyplot as plt
import numpy as np

# Get the 'tab20' and 'tab20b' colormaps
cmap1 = plt.get_cmap('tab20')
cmap2 = plt.get_cmap('tab20b')

# Combine the colormaps
combined_cmap = ListedColormap(cmap1.colors + cmap2.colors)

# Plot the data with combined colormap
plt.pcolormesh(np.random.rand(10,10), cmap=combined_cmap)
plt.colorbar()
plt.show()
Output:
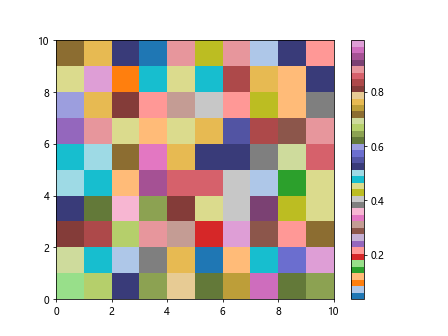
In this example, we combine the ‘tab20’ and ‘tab20b’ colormaps using ListedColormap and use it in a pcolormesh plot.
Creating Custom Colormaps
If the built-in colormaps do not meet your requirements, you can create custom colormaps using ListedColormap and LinearSegmentedColormap. Here is an example of creating a custom colormap:
from matplotlib.colors import LinearSegmentedColormap
import matplotlib.pyplot as plt
import numpy as np

# Create custom colormap data
cmap_data = {
    'red': [(0.0, 1.0, 1.0),
            (0.5, 0.0, 0.0),
            (1.0, 0.4, 0.4)],

    'green': [(0.0, 0.0, 0.0),
              (0.5, 1.0, 1.0),
              (1.0, 0.4, 0.4)],

    'blue': [(0.0, 0.4, 0.4),
             (0.5, 0.0, 0.0),
             (1.0, 1.0, 1.0)],
}

# Create custom colormap
custom_cmap = LinearSegmentedColormap('CustomCmap', cmap_data)

# Plot the data with custom colormap
plt.imshow(np.random.rand(10,10), cmap=custom_cmap)
plt.colorbar()
plt.show()
Output:
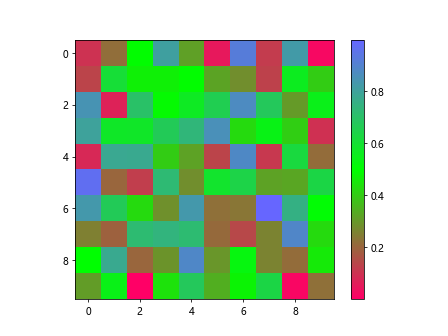
In this example, we create a custom colormap with specified color values for red, green, and blue channels using LinearSegmentedColormap and use it in an image plot.
Saving Colormaps
You can also save custom colormaps for future use by saving the colormap data to a file. Here is an example of saving a custom colormap:
# Save custom colormap data to a file
np.save('custom_cmap.npy', cmap_data)
In this example, we save the custom colormap data to a file named ‘custom_cmap.npy’ using np.save.
Loading Colormaps
To load a custom colormap saved in a file, you can use the np.load function. Here is an example of loading a custom colormap:
# Load custom colormap data from a file
loaded_cmap_data = np.load('custom_cmap.npy', allow_pickle=True).item()

# Create custom colormap from loaded data
loaded_custom_cmap = LinearSegmentedColormap('LoadedCustomCmap', loaded_cmap_data)

# Plot the data with loaded custom colormap
plt.imshow(np.random.rand(10,10), cmap=loaded_custom_cmap)
plt.colorbar()
plt.show()
In this example, we load the custom colormap data from the ‘custom_cmap.npy’ file using np.load and create a custom colormap from the loaded data.
Conclusion
In this article, we have explored how to use matplotlib.cm.get_cmap to retrieve and manipulate colormaps in Matplotlib visualizations. By choosing the right colormap, specifying colormap range, creating custom colormaps, and combining colormaps, you can enhance the visual aesthetics of your plots and effectively communicate your data insights. Experiment with different colormaps and techniques to create visually stunning and informative visualizations in Matplotlib.