How to Customize Matplotlib Legend Font Size: A Comprehensive Guide
Matplotlib legend font size is an essential aspect of creating clear and visually appealing plots. In this comprehensive guide, we’ll explore various methods to adjust the matplotlib legend font size, providing you with the tools to enhance your data visualizations. From basic techniques to advanced customization options, we’ll cover everything you need to know about controlling the font size of your matplotlib legends.
Understanding Matplotlib Legend Font Size
Matplotlib legend font size refers to the size of the text used in the legend of a plot. The legend is a crucial component of any graph, as it provides context and helps viewers interpret the data presented. By adjusting the matplotlib legend font size, you can ensure that your legend is easily readable and complements the overall design of your plot.
Let’s start with a basic example of how to create a plot with a legend and set its font size:
import matplotlib.pyplot as plt

# Create a simple plot
plt.plot([1, 2, 3, 4], [1, 4, 2, 3], label='Line 1')
plt.plot([1, 2, 3, 4], [2, 3, 4, 1], label='Line 2')

# Add a legend with custom font size
plt.legend(fontsize=12)

# Add a title to showcase how2matplotlib.com
plt.title('Simple Plot - how2matplotlib.com')

plt.show()
Output:
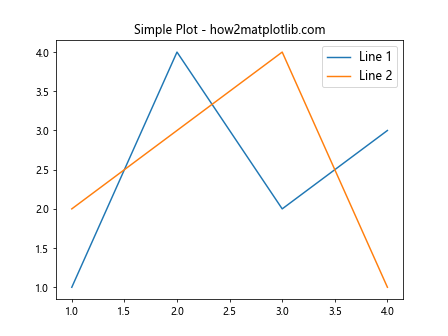
In this example, we’ve created two lines and added a legend with a font size of 12 points. The fontsize parameter in the plt.legend() function allows us to easily adjust the matplotlib legend font size.
Setting Matplotlib Legend Font Size Globally
If you want to set a consistent matplotlib legend font size across all your plots in a script or notebook, you can use the rcParams dictionary. This approach is particularly useful when you’re creating multiple plots and want to maintain a uniform style.
Here’s an example of how to set the matplotlib legend font size globally:
import matplotlib.pyplot as plt

# Set the global legend font size
plt.rcParams['legend.fontsize'] = 14

# Create two subplots
fig, (ax1, ax2) = plt.subplots(1, 2, figsize=(12, 5))

# Plot data on the first subplot
ax1.plot([1, 2, 3, 4], [1, 4, 2, 3], label='Line 1')
ax1.plot([1, 2, 3, 4], [2, 3, 4, 1], label='Line 2')
ax1.legend()
ax1.set_title('Subplot 1 - how2matplotlib.com')

# Plot data on the second subplot
ax2.plot([1, 2, 3, 4], [3, 1, 4, 2], label='Line 3')
ax2.plot([1, 2, 3, 4], [4, 3, 2, 1], label='Line 4')
ax2.legend()
ax2.set_title('Subplot 2 - how2matplotlib.com')

plt.tight_layout()
plt.show()
Output:
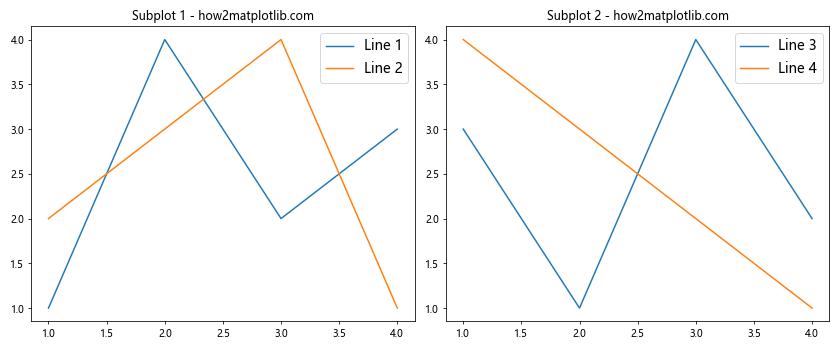
In this example, we’ve set the global matplotlib legend font size to 14 points using plt.rcParams['legend.fontsize'] = 14. This setting will apply to all legends created in the script unless overridden locally.
Adjusting Matplotlib Legend Font Size for Individual Plots
While setting a global matplotlib legend font size can be convenient, there may be times when you want to customize the font size for specific plots. Matplotlib provides several ways to achieve this.
Using the fontsize Parameter
The simplest way to adjust the matplotlib legend font size for an individual plot is by using the fontsize parameter in the legend() function. Here’s an example:
import matplotlib.pyplot as plt

# Create a plot with custom legend font size
plt.figure(figsize=(8, 6))
plt.plot([1, 2, 3, 4], [1, 4, 2, 3], label='Data 1')
plt.plot([1, 2, 3, 4], [2, 3, 4, 1], label='Data 2')
plt.plot([1, 2, 3, 4], [3, 1, 4, 2], label='Data 3')

# Add a legend with custom font size
plt.legend(fontsize=16)

plt.title('Custom Legend Font Size - how2matplotlib.com')
plt.xlabel('X-axis')
plt.ylabel('Y-axis')

plt.show()
Output:
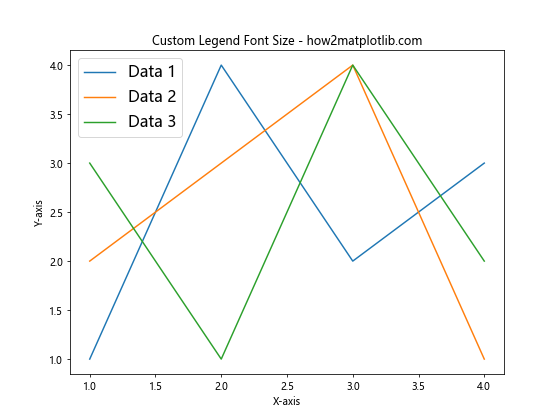
In this example, we’ve set the matplotlib legend font size to 16 points using plt.legend(fontsize=16). This approach allows you to easily customize the font size for each plot individually.
Adjusting Matplotlib Legend Font Size in Subplots
When working with subplots, you may want to set different matplotlib legend font sizes for each subplot. Here’s an example of how to achieve this:
import matplotlib.pyplot as plt

# Create a figure with two subplots
fig, (ax1, ax2) = plt.subplots(1, 2, figsize=(12, 5))

# Plot data on the first subplot
ax1.plot([1, 2, 3, 4], [1, 4, 2, 3], label='Data A')
ax1.plot([1, 2, 3, 4], [2, 3, 4, 1], label='Data B')
ax1.legend(fontsize=10)
ax1.set_title('Subplot 1 - how2matplotlib.com')

# Plot data on the second subplot
ax2.plot([1, 2, 3, 4], [3, 1, 4, 2], label='Data C')
ax2.plot([1, 2, 3, 4], [4, 3, 2, 1], label='Data D')
ax2.legend(fontsize=14)
ax2.set_title('Subplot 2 - how2matplotlib.com')

plt.tight_layout()
plt.show()
Output:
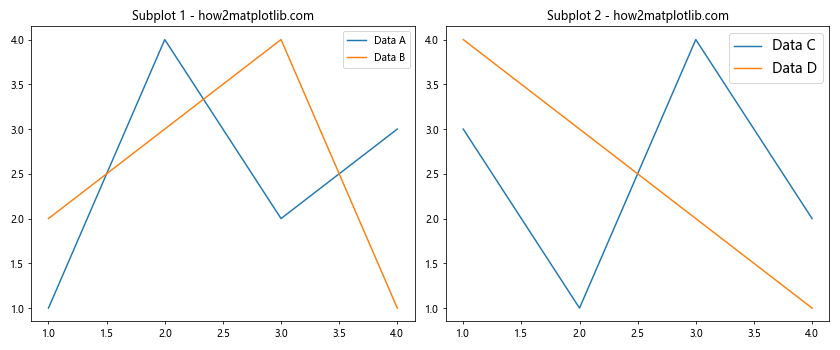
In this example, we’ve created two subplots and set different matplotlib legend font sizes for each. The first subplot uses a font size of 10 points, while the second subplot uses a font size of 14 points.
Scaling Matplotlib Legend Font Size Relative to Figure Size
Sometimes, you may want to scale the matplotlib legend font size relative to the size of your figure. This can be particularly useful when creating plots that need to be resized for different display contexts. Here’s an example of how to achieve this:
import matplotlib.pyplot as plt

def scale_legend_font_size(fig, base_size=12):
    # Get the figure size in inches
    fig_width, fig_height = fig.get_size_inches()

    # Calculate the scaling factor based on the figure size
    scale_factor = min(fig_width, fig_height) / 8

    # Calculate the new font size
    new_size = base_size * scale_factor

    return new_size

# Create a figure
fig, ax = plt.subplots(figsize=(10, 6))

# Plot some data
ax.plot([1, 2, 3, 4], [1, 4, 2, 3], label='Data 1')
ax.plot([1, 2, 3, 4], [2, 3, 4, 1], label='Data 2')

# Calculate the scaled font size
scaled_font_size = scale_legend_font_size(fig)

# Add a legend with the scaled font size
ax.legend(fontsize=scaled_font_size)

ax.set_title('Scaled Legend Font Size - how2matplotlib.com')
plt.show()
Output:
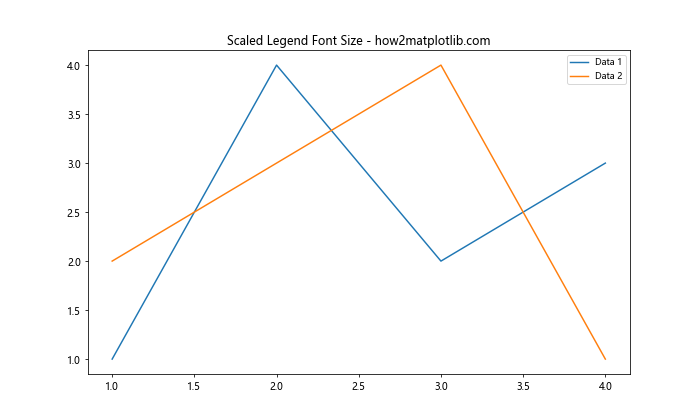
In this example, we’ve defined a function scale_legend_font_size() that calculates a scaled font size based on the figure dimensions. This approach ensures that the matplotlib legend font size remains proportional to the overall plot size.
Adjusting Matplotlib Legend Font Size for Different Legend Locations
The optimal matplotlib legend font size may vary depending on where you place the legend within your plot. Let’s explore how to adjust the font size for different legend locations:
import matplotlib.pyplot as plt

# Create a figure with multiple subplots
fig, ((ax1, ax2), (ax3, ax4)) = plt.subplots(2, 2, figsize=(12, 10))

# Function to plot data and add legend
def plot_with_legend(ax, loc, fontsize):
    ax.plot([1, 2, 3, 4], [1, 4, 2, 3], label='Data X')
    ax.plot([1, 2, 3, 4], [2, 3, 4, 1], label='Data Y')
    ax.legend(loc=loc, fontsize=fontsize)
    ax.set_title(f'Legend at {loc} - how2matplotlib.com')

# Plot with different legend locations and font sizes
plot_with_legend(ax1, 'upper right', 10)
plot_with_legend(ax2, 'upper left', 12)
plot_with_legend(ax3, 'lower right', 14)
plot_with_legend(ax4, 'lower left', 16)

plt.tight_layout()
plt.show()
Output:
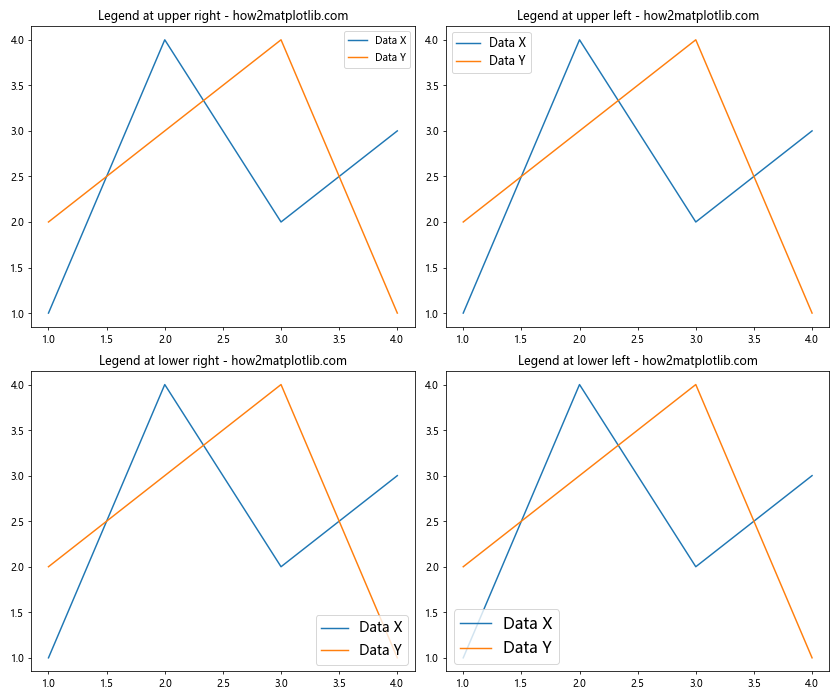
In this example, we’ve created four subplots, each with a legend in a different location and with a different matplotlib legend font size. This allows you to see how the font size affects the legend’s readability in various positions.
Using Matplotlib Legend Font Size with Different Plot Types
The matplotlib legend font size can be adjusted for various types of plots. Let’s look at how to customize the legend font size for different plot types:
Bar Plot
import matplotlib.pyplot as plt
import numpy as np

# Create data for the bar plot
categories = ['A', 'B', 'C', 'D']
values1 = [4, 7, 3, 6]
values2 = [3, 5, 2, 4]

# Create the bar plot
x = np.arange(len(categories))
width = 0.35

fig, ax = plt.subplots(figsize=(10, 6))
rects1 = ax.bar(x - width/2, values1, width, label='Group 1')
rects2 = ax.bar(x + width/2, values2, width, label='Group 2')

# Customize the plot
ax.set_ylabel('Values')
ax.set_title('Bar Plot with Custom Legend - how2matplotlib.com')
ax.set_xticks(x)
ax.set_xticklabels(categories)

# Add a legend with custom font size
ax.legend(fontsize=14)

plt.tight_layout()
plt.show()
Output:
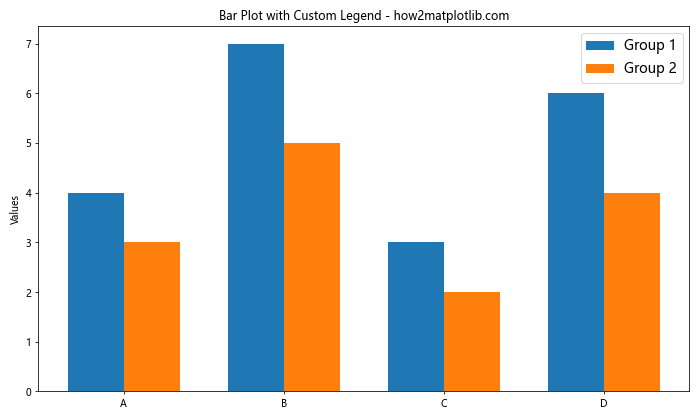
In this example, we’ve created a bar plot with two groups of data and set the matplotlib legend font size to 14 points.
Scatter Plot
import matplotlib.pyplot as plt
import numpy as np

# Generate random data for the scatter plot
np.random.seed(42)
x1 = np.random.rand(50)
y1 = np.random.rand(50)
x2 = np.random.rand(50)
y2 = np.random.rand(50)

# Create the scatter plot
plt.figure(figsize=(10, 6))
plt.scatter(x1, y1, c='blue', label='Group A', alpha=0.7)
plt.scatter(x2, y2, c='red', label='Group B', alpha=0.7)

# Customize the plot
plt.xlabel('X-axis')
plt.ylabel('Y-axis')
plt.title('Scatter Plot with Custom Legend - how2matplotlib.com')

# Add a legend with custom font size
plt.legend(fontsize=16)

plt.tight_layout()
plt.show()
Output:
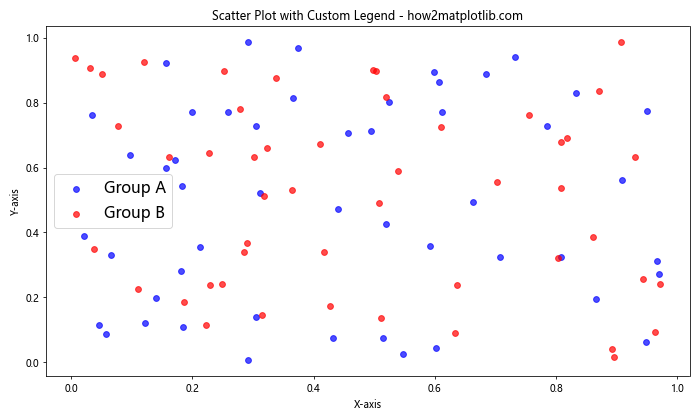
In this scatter plot example, we’ve set the matplotlib legend font size to 16 points to ensure good readability against the scattered data points.
Advanced Techniques for Matplotlib Legend Font Size Customization
For more advanced control over the matplotlib legend font size, you can use the Legend object directly. This approach allows for fine-grained customization of individual legend elements.
import matplotlib.pyplot as plt

# Create a plot
fig, ax = plt.subplots(figsize=(10, 6))
line1, = ax.plot([1, 2, 3, 4], [1, 4, 2, 3], label='Data Series 1')
line2, = ax.plot([1, 2, 3, 4], [2, 3, 4, 1], label='Data Series 2')

# Create a legend
legend = ax.legend(fontsize=12)

# Customize individual legend text items
for text in legend.get_texts():
    if text.get_text() == 'Data Series 1':
        text.set_fontsize(14)
    elif text.get_text() == 'Data Series 2':
        text.set_fontsize(10)

ax.set_title('Advanced Legend Customization - how2matplotlib.com')
plt.show()
Output:
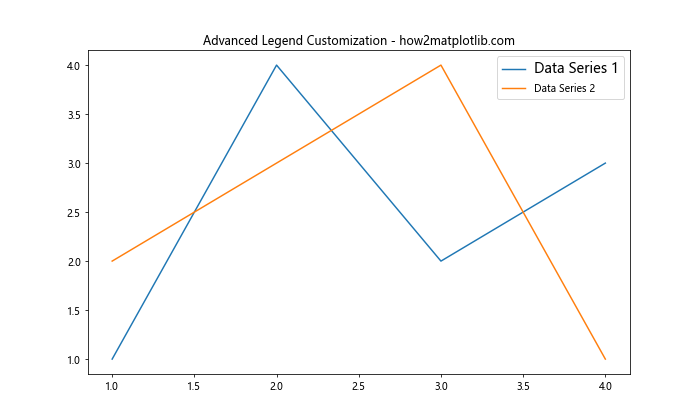
In this example, we’ve created a legend and then customized the font size of individual legend items based on their labels. This technique allows for very specific control over the matplotlib legend font size for each element.
Handling Matplotlib Legend Font Size in Complex Plots
When dealing with complex plots that have multiple data series and potentially multiple legends, managing the matplotlib legend font size becomes even more important. Let’s look at an example of how to handle this:
import matplotlib.pyplot as plt
import numpy as np

# Generate some data
x = np.linspace(0, 10, 100)
y1 = np.sin(x)
y2 = np.cos(x)
y3 = np.tan(x)
y4 = x**2
y5 = x**3

# Create a complex plot with multiple data series
fig, (ax1, ax2) = plt.subplots(2, 1, figsize=(12, 10))

# Plot on the first subplot
ax1.plot(x, y1, label='sin(x)')
ax1.plot(x, y2, label='cos(x)')
ax1.plot(x, y3, label='tan(x)')
ax1.set_title('Trigonometric Functions - how2matplotlib.com')
ax1.legend(fontsize=12, loc='upper left')

# Plot on the second subplot
ax2.plot(x, y4, label='x^2')
ax2.plot(x, y5, label='x^3')
ax2.set_title('Polynomial Functions - how2matplotlib.com')
ax2.legend(fontsize=12, loc='upper left')

# Add a common legend for both subplots
lines1, labels1 = ax1.get_legend_handles_labels()
lines2, labels2 = ax2.get_legend_handles_labels()
fig.legend(lines1 + lines2, labels1 + labels2, loc='center right', fontsize=14, bbox_to_anchor=(1.1, 0.5))

plt.tight_layout()plt.show()
Output:
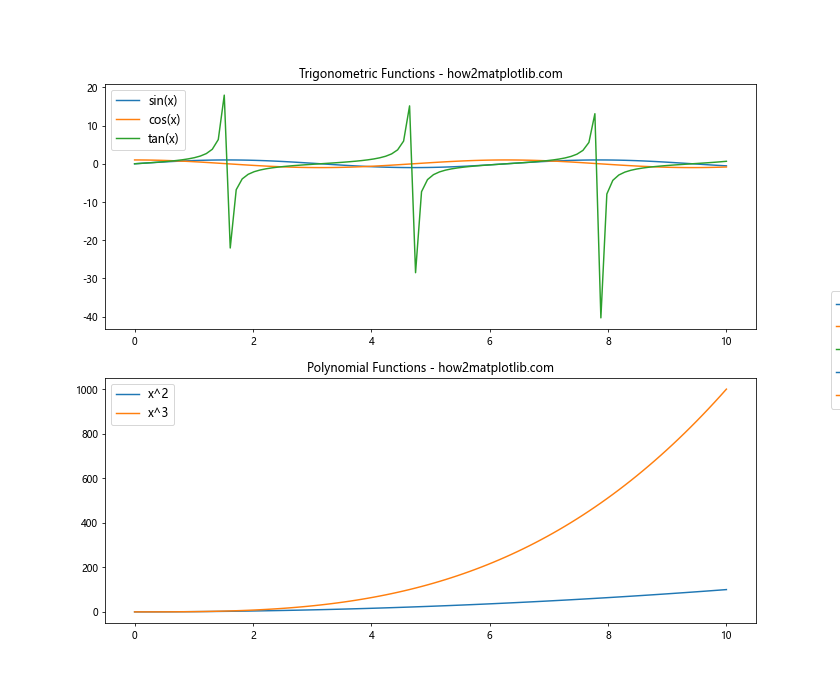
In this complex plot example, we’ve created two subplots with multiple data series in each. We’ve set the matplotlib legend font size for each subplot’s legend to 12 points, and then created a common legend for the entire figure with a font size of 14 points. This approach allows for clear organization of the legend information across a complex multi-plot figure.
Responsive Matplotlib Legend Font Size
When creating plots that need to be responsive to different screen sizes or when embedding plots in web applications, it’s useful to have a matplotlib legend font size that adapts to the plot’s dimensions. Here’s an example of how to achieve this:
import matplotlib.pyplot as plt

def responsive_legend_font_size(fig, ax, base_size=12, size_factor=0.015):
    # Get the figure size in pixels
    fig_width, fig_height = fig.get_size_inches() * fig.dpi

    # Calculate the plot area size
    bbox = ax.get_window_extent().transformed(fig.dpi_scale_trans.inverted())
    plot_width, plot_height = bbox.width * fig.dpi, bbox.height * fig.dpi

    # Calculate the average dimension
    avg_dimension = (plot_width + plot_height) / 2

    # Calculate the responsive font size
    font_size = base_size + avg_dimension * size_factor

    return font_size

# Create a plot
fig, ax = plt.subplots(figsize=(10, 6))
ax.plot([1, 2, 3, 4], [1, 4, 2, 3], label='Data A')
ax.plot([1, 2, 3, 4], [2, 3, 4, 1], label='Data B')

# Calculate the responsive font size
responsive_size = responsive_legend_font_size(fig, ax)

# Add a legend with the responsive font size
ax.legend(fontsize=responsive_size)

ax.set_title('Responsive Legend Font Size - how2matplotlib.com')
plt.show()
Output:
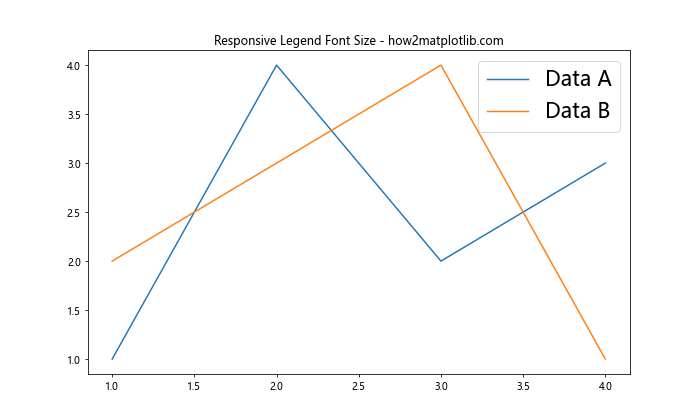
In this example, we’ve created a function responsive_legend_font_size() that calculates a font size based on the dimensions of the plot area. This ensures that the matplotlib legend font size remains proportional to the plot size, regardless of how it’s displayed.
Handling Matplotlib Legend Font Size with Long Labels
When dealing with legends that have long labels, managing the matplotlib legend font size becomes crucial for maintaining readability and preventing overlap. Here’s an example of how to handle this situation:
import matplotlib.pyplot as plt

# Create data with long labels
data = {
    'Category A with a very long name': [1, 4, 2, 3],
    'Category B with an even longer name': [2, 3, 4, 1],
    'Category C with the longest name of all': [3, 1, 4, 2]
}

# Create the plot
fig, ax = plt.subplots(figsize=(12, 6))

for label, values in data.items():
    ax.plot([1, 2, 3, 4], values, label=label)

# Customize the legend
ax.legend(fontsize=10, loc='center left', bbox_to_anchor=(1, 0.5))

ax.set_title('Plot with Long Legend Labels - how2matplotlib.com')
plt.tight_layout()
plt.show()
Output:
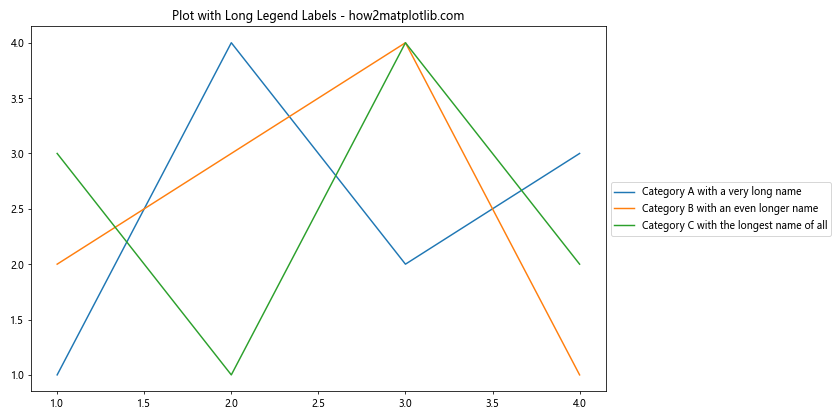
In this example, we’ve used a smaller matplotlib legend font size (10 points) to accommodate the long labels. We’ve also positioned the legend outside the plot area using bbox_to_anchor to prevent it from overlapping with the plot data.
Matplotlib Legend Font Size in Logarithmic Plots
When working with logarithmic scales, it’s important to ensure that the matplotlib legend font size is appropriate for the scale of the plot. Here’s an example:
import matplotlib.pyplot as plt
import numpy as np

# Generate data for logarithmic plot
x = np.logspace(0, 3, 50)
y1 = x**2
y2 = x**3

# Create the logarithmic plot
fig, ax = plt.subplots(figsize=(10, 6))
ax.loglog(x, y1, label='y = x^2')
ax.loglog(x, y2, label='y = x^3')

# Customize the legend
ax.legend(fontsize=12)

ax.set_xlabel('X-axis (log scale)')
ax.set_ylabel('Y-axis (log scale)')
ax.set_title('Logarithmic Plot - how2matplotlib.com')

plt.tight_layout()
plt.show()
Output:
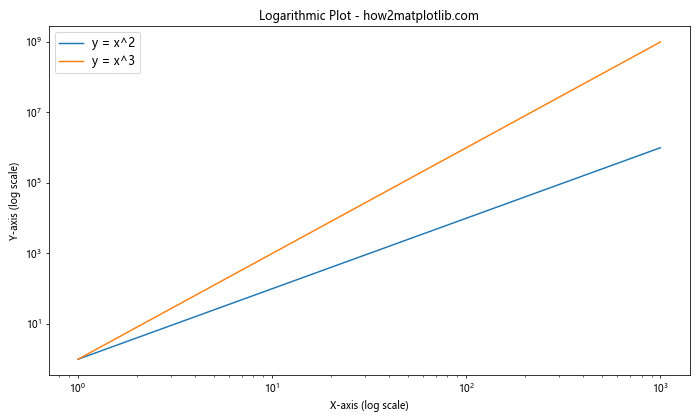
In this logarithmic plot example, we’ve set the matplotlib legend font size to 12 points, which provides good readability against the logarithmic scale.
Matplotlib Legend Font Size in 3D Plots
When creating 3D plots, the matplotlib legend font size needs to be carefully chosen to ensure visibility against the 3D backdrop. Here’s an example:
import matplotlib.pyplot as plt
import numpy as np

# Generate data for 3D plot
x = np.linspace(-5, 5, 100)
y = np.linspace(-5, 5, 100)
X, Y = np.meshgrid(x, y)
Z1 = np.sin(np.sqrt(X**2 + Y**2))
Z2 = np.cos(np.sqrt(X**2 + Y**2))

# Create the 3D plot
fig = plt.figure(figsize=(12, 8))
ax = fig.add_subplot(111, projection='3d')

# Plot the surfaces
surf1 = ax.plot_surface(X, Y, Z1, cmap='viridis', alpha=0.7, label='sin(r)')
surf2 = ax.plot_surface(X, Y, Z2, cmap='plasma', alpha=0.7, label='cos(r)')

# Add a legend
ax.legend(fontsize=12)

ax.set_xlabel('X-axis')
ax.set_ylabel('Y-axis')
ax.set_zlabel('Z-axis')
ax.set_title('3D Plot - how2matplotlib.com')

plt.tight_layout()
plt.show()
Output:
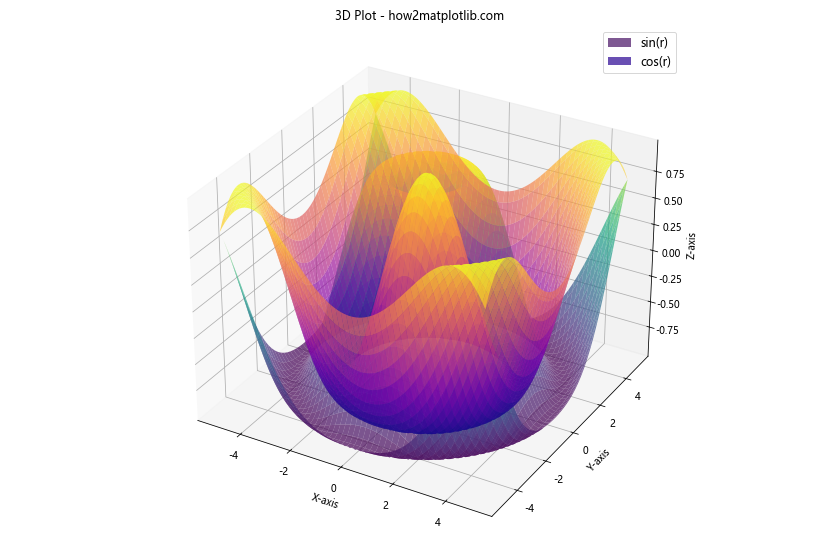
In this 3D plot example, we’ve set the matplotlib legend font size to 12 points, which provides good visibility against the 3D surface plots.
Matplotlib legend font size Conclusion
Mastering the control of matplotlib legend font size is crucial for creating clear, professional-looking plots. Throughout this comprehensive guide, we’ve explored various techniques for adjusting the font size of legends in Matplotlib, from basic methods to advanced customization options.
We’ve covered setting the matplotlib legend font size globally, adjusting it for individual plots, handling font size in subplots, scaling font size relative to figure size, and customizing font size for different plot types. We’ve also delved into more advanced topics such as responsive font sizing, handling long labels, and adjusting font size in specialized plots like logarithmic and 3D visualizations.
By applying these techniques, you can ensure that your legends are always readable and well-integrated with your plots, regardless of the complexity of your data visualization. Remember that the optimal matplotlib legend font size may vary depending on the specific requirements of your plot, the amount of data being displayed, and the intended viewing medium.
As you continue to work with Matplotlib, experiment with different font sizes and legend styles to find the perfect balance for your specific visualization needs. With the knowledge gained from this guide, you’ll be well-equipped to create stunning, informative plots with perfectly sized legends.