Matplotlib Label Points with Coordinates
Matplotlib is a powerful Python library for creating visualizations. One common task when creating plots is to label points with their coordinates. In this article, we will explore various methods to achieve this using Matplotlib.
Method 1: Using annotate()
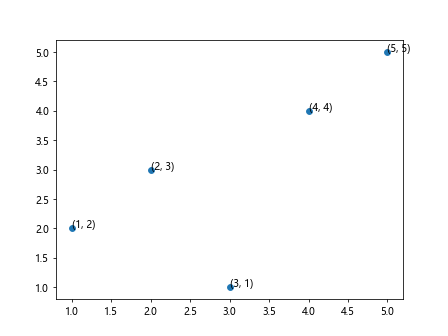
The annotate() function in Matplotlib can be used to add annotations to a plot. We can use this function to label points with their coordinates.
import matplotlib.pyplot as plt

# Create a scatter plot
x = [1, 2, 3, 4, 5]
y = [2, 3, 1, 4, 5]
plt.scatter(x, y)

# Label points with coordinates
for i, txt in enumerate(zip(x, y)):
    plt.annotate(txt, (x[i], y[i]))

plt.show()
Output:
Method 2: Using text()
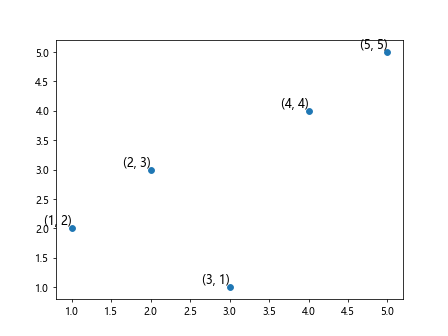
Another method to label points with coordinates is to use the text() function in Matplotlib.
import matplotlib.pyplot as plt

# Create a scatter plot
x = [1, 2, 3, 4, 5]
y = [2, 3, 1, 4, 5]
plt.scatter(x, y)

# Label points with coordinates
for i, txt in enumerate(zip(x, y)):
    plt.text(x[i], y[i], f'{txt}', fontsize=12, verticalalignment='bottom', horizontalalignment='right')

plt.show()
Output:
Method 3: Using Axis.set_xticks() and Axis.set_yticks()
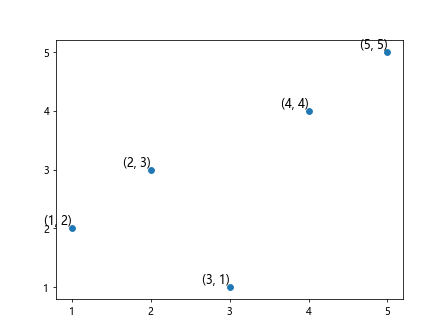
We can also label points with coordinates by setting the x and y ticks of the plot.
import matplotlib.pyplot as plt

# Create a scatter plot
x = [1, 2, 3, 4, 5]
y = [2, 3, 1, 4, 5]
plt.scatter(x, y)

# Label points with coordinates
axes = plt.gca()
axes.set_xticks(x)
axes.set_yticks(y)

for i, txt in enumerate(zip(x, y)):
    plt.text(x[i], y[i], f'{txt}', fontsize=12, verticalalignment='bottom', horizontalalignment='right')

plt.show()
Output:
Method 4: Using patches
We can also label points with coordinates using patches.
import matplotlib.pyplot as plt
import matplotlib.patches as mpatches

# Create a scatter plot
x = [1, 2, 3, 4, 5]
y = [2, 3, 1, 4, 5]
plt.scatter(x, y)

# Label points with coordinates
for i, txt in enumerate(zip(x, y)):
    plt.gca().add_patch(mpatches.Text(txt, (x[i], y[i]), fontsize=12, verticalalignment='bottom', horizontalalignment='right'))

plt.show()
Method 5: Using a Custom Function
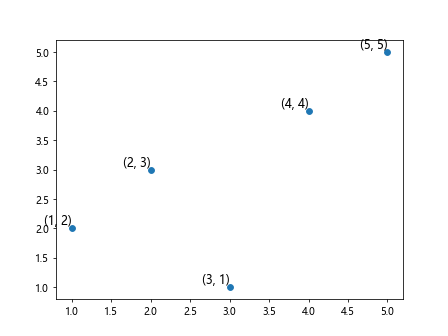
We can also create a custom function to label points with coordinates.
import matplotlib.pyplot as plt

# Custom function to label points
def label_points(x, y):
    for i, txt in enumerate(zip(x, y)):
        plt.text(x[i], y[i], f'{txt}', fontsize=12, verticalalignment='bottom', horizontalalignment='right')

# Create a scatter plot
x = [1, 2, 3, 4, 5]
y = [2, 3, 1, 4, 5]
plt.scatter(x, y)

# Label points with coordinates using the custom function
label_points(x, y)

plt.show()
Output:
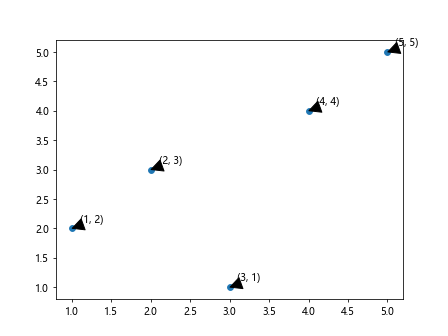
Method 6: Using Annotations with Arrows
We can also label points with coordinates using annotations with arrows.
import matplotlib.pyplot as plt

# Create a scatter plot
x = [1, 2, 3, 4, 5]
y = [2, 3, 1, 4, 5]
plt.scatter(x, y)

# Label points with coordinates using annotations with arrows
for i, txt in enumerate(zip(x, y)):
    plt.annotate(f'{txt}', (x[i], y[i]), xytext=(x[i]+0.1, y[i]+0.1), arrowprops=dict(facecolor='black', shrink=0.05))

plt.show()
Output:
Method 7: Adding Labels Using a Loop
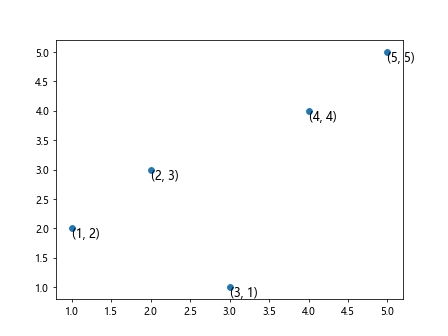
We can also label points with coordinates by adding labels using a loop.
import matplotlib.pyplot as plt

# Create a scatter plot
x = [1, 2, 3, 4, 5]
y = [2, 3, 1, 4, 5]
plt.scatter(x, y)

# Label points with coordinates using a loop
for i, (xi, yi) in enumerate(zip(x, y)):
    plt.text(xi, yi, f'({xi}, {yi})', fontsize=12, verticalalignment='top', horizontalalignment='left')

plt.show()
Output:
Method 8: Using a Dictionary to Label Points
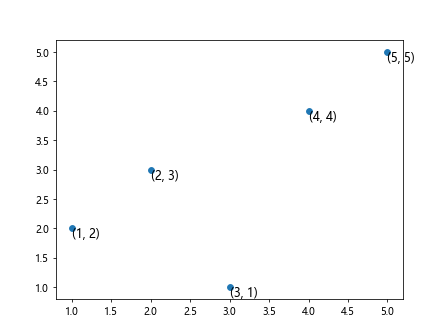
We can also label points with coordinates using a dictionary.
import matplotlib.pyplot as plt

# Create a scatter plot
x = [1, 2, 3, 4, 5]
y = [2, 3, 1, 4, 5]
plt.scatter(x, y)

# Create a dictionary of labels
labels = {1: '(1, 2)', 2: '(2, 3)', 3: '(3, 1)', 4: '(4, 4)', 5: '(5, 5)'}

# Label points with coordinates using the dictionary
for i in range(len(x)):
    plt.text(x[i], y[i], labels.get(x[i]), fontsize=12, verticalalignment='top', horizontalalignment='left')

plt.show()
Output:
Method 9: Labeling Points with Custom Annotations
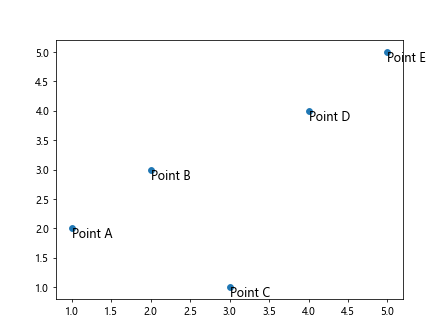
We can also label points with custom annotations.
import matplotlib.pyplot as plt

# Create a scatter plot
x = [1, 2, 3, 4, 5]
y = [2, 3, 1, 4, 5]
plt.scatter(x, y)

# Custom annotations
annotations = ['Point A', 'Point B', 'Point C', 'Point D', 'Point E']

# Label points with custom annotations
for i, (xi, yi, annotation) in enumerate(zip(x, y, annotations)):
    plt.text(xi, yi, annotation, fontsize=12, verticalalignment='top', horizontalalignment='left')

plt.show()
Output:
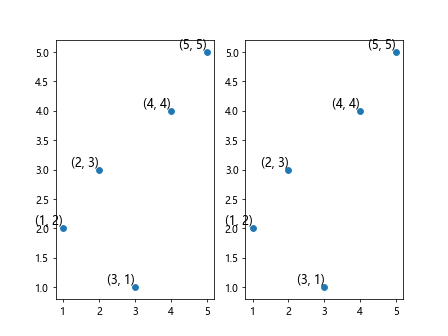
Method 10: Labeling Points with Coordinates in Subplots
We can also label points with coordinates in subplots.
import matplotlib.pyplot as plt

# Create two scatter plots in subplots
x = [1, 2, 3, 4, 5]
y = [2, 3, 1, 4, 5]

fig, axs = plt.subplots(1, 2)

# Plot the first scatter plot
axs[0].scatter(x, y)
for i, txt in enumerate(zip(x, y)):
    axs[0].text(x[i], y[i], f'{txt}', fontsize=12, verticalalignment='bottom', horizontalalignment='right')

# Plot the second scatter plot
axs[1].scatter(x, y)
for i, txt in enumerate(zip(x, y)):
    axs[1].text(x[i], y[i], f'{txt}', fontsize=12, verticalalignment='bottom', horizontalalignment='right')

plt.show()
Output:
In this article, we explored various methods to label points with coordinates using Matplotlib. These methods provide flexibility and customization options for creating informative and visually appealing visualizations. Choose the method that best suits your needs and experiment with different approaches to create stunning plots with labeled points.