Matplotlib Label Point
Matplotlib is a powerful visualization library in Python that allows users to create various types of plots and charts. One common task in data visualization is to label specific data points in a plot. In this article, we will explore how to label points in a matplotlib plot using different techniques.
Method 1: Using plt.text()
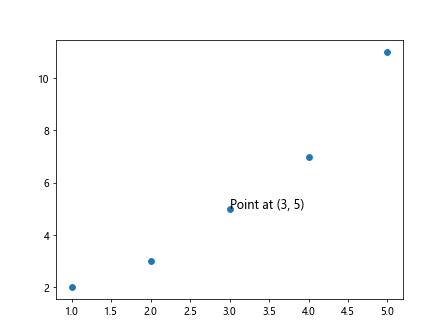
The plt.text() function in matplotlib can be used to place text at any location on the plot. This function takes the x and y coordinates of the text as arguments.
import matplotlib.pyplot as plt

x = [1, 2, 3, 4, 5]
y = [2, 3, 5, 7, 11]

plt.scatter(x, y)

# Label a specific point
plt.text(3, 5, 'Point at (3, 5)', fontsize=12)

plt.show()
Output:
Method 2: Using plt.annotate()
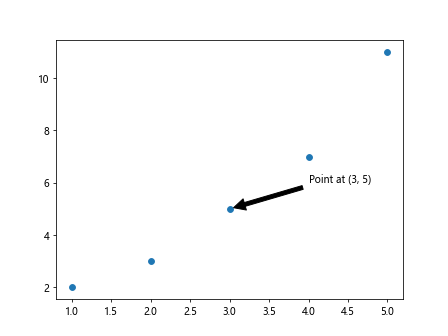
Another way to label points in a matplotlib plot is to use the plt.annotate() function. This function allows you to add text with an arrow pointing to a specific data point.
import matplotlib.pyplot as plt

x = [1, 2, 3, 4, 5]
y = [2, 3, 5, 7, 11]

plt.scatter(x, y)

# Annotate a specific point
plt.annotate('Point at (3, 5)', xy=(3, 5), xytext=(4, 6),
             arrowprops=dict(facecolor='black', shrink=0.05))

plt.show()
Output:
Method 3: Labeling Multiple Points
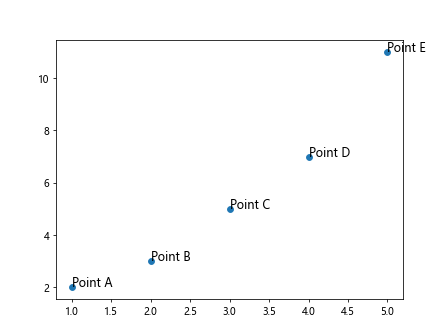
If you want to label multiple points in a plot, you can use a loop to iterate through the data points and add labels using plt.text() or plt.annotate().
import matplotlib.pyplot as plt

x = [1, 2, 3, 4, 5]
y = [2, 3, 5, 7, 11]

plt.scatter(x, y)

# Label multiple points
labels = ['Point A', 'Point B', 'Point C', 'Point D', 'Point E']
for i, label in enumerate(labels):
    plt.text(x[i], y[i], label, fontsize=12)

plt.show()
Output:
Method 4: Customizing Labels
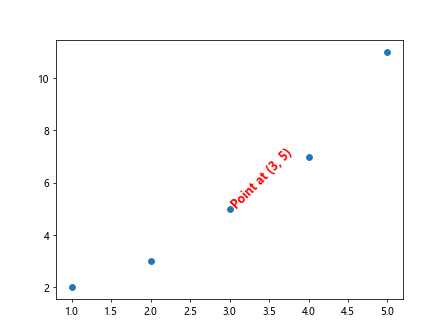
You can customize the appearance of the labels by specifying different properties such as font size, color, and style.
import matplotlib.pyplot as plt

x = [1, 2, 3, 4, 5]
y = [2, 3, 5, 7, 11]

plt.scatter(x, y)

plt.text(3, 5, 'Point at (3, 5)', fontsize=12, color='red', weight='bold', rotation=45)

plt.show()
Output:
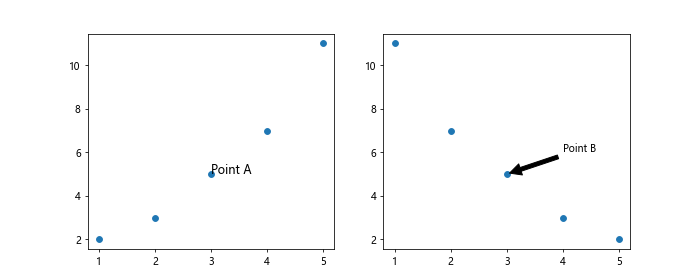
Method 5: Labeling Subplots
If you have multiple subplots in a figure, you can label specific points in each subplot using the techniques mentioned above.
import matplotlib.pyplot as plt

# Creating subplots
fig, axs = plt.subplots(1, 2, figsize=(10, 4))

x1 = [1, 2, 3, 4, 5]
y1 = [2, 3, 5, 7, 11]

x2 = [1, 2, 3, 4, 5]
y2 = [11, 7, 5, 3, 2]

axs[0].scatter(x1, y1)
axs[1].scatter(x2, y2)

# Label points in subplots
axs[0].text(3, 5, 'Point A', fontsize=12)
axs[1].annotate('Point B', xy=(3, 5), xytext=(4, 6),
             arrowprops=dict(facecolor='black', shrink=0.05))

plt.show()
Output:
Method 6: Using Object-Oriented Interface
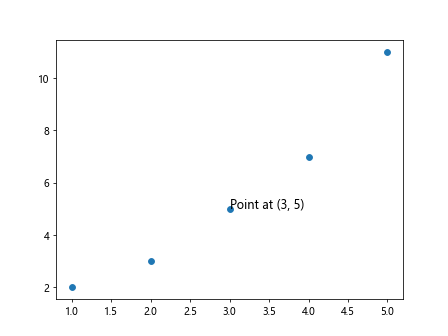
In addition to the pyplot interface, you can also label points using the object-oriented interface of matplotlib.
import matplotlib.pyplot as plt

x = [1, 2, 3, 4, 5]
y = [2, 3, 5, 7, 11]

fig, ax = plt.subplots()

ax.scatter(x, y)
ax.text(3, 5, 'Point at (3, 5)', fontsize=12)

plt.show()
Output:
Method 7: Labeling Points in a Line Plot
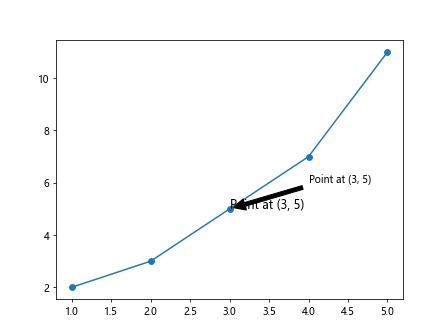
You can also label specific points in a line plot using the same techniques mentioned above.
import matplotlib.pyplot as plt

x = [1, 2, 3, 4, 5]
y = [2, 3, 5, 7, 11]

plt.plot(x, y, marker='o')

plt.text(3, 5, 'Point at (3, 5)', fontsize=12)
plt.annotate('Point at (3, 5)', xy=(3, 5), xytext=(4, 6),
             arrowprops=dict(facecolor='black', shrink=0.05))

plt.show()
Output:
Method 8: Labeling Points in a Bar Chart
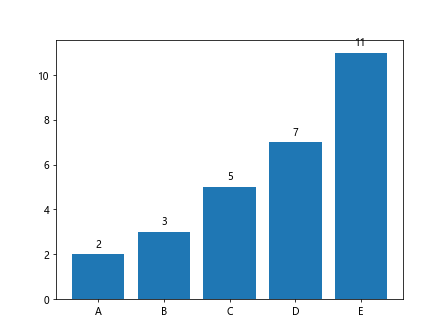
If you are creating a bar chart, you can label specific bars by adding text above or below the bars.
import matplotlib.pyplot as plt

x = ['A', 'B', 'C', 'D', 'E']
y = [2, 3, 5, 7, 11]

plt.bar(x, y)

# Label bars
for i, v in enumerate(y):
    plt.text(i, v + 0.3, str(v), ha='center')

plt.show()
Output:
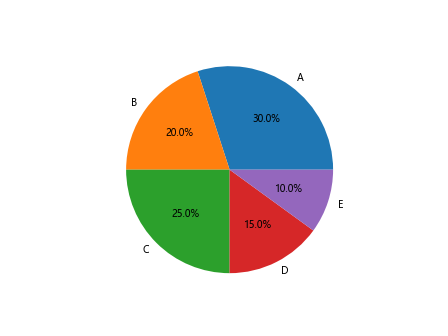
Method 9: Labeling Points in a Pie Chart
In a pie chart, you can label each wedge with the corresponding percentage using the plt.pie() function.
import matplotlib.pyplot as plt

sizes = [30, 20, 25, 15, 10]
labels = ['A', 'B', 'C', 'D', 'E']

plt.pie(sizes, labels=labels, autopct='%1.1f%%')

plt.show()
Output:
Conclusion
In this article, we have explored different methods to label points in a matplotlib plot. Whether you are working with scatter plots, line plots, bar charts, or pie charts, there are various techniques available to help you add labels to specific data points. By using functions like plt.text() and plt.annotate(), you can effectively communicate information and highlight important points in your visualizations. Next time you create a plot in matplotlib, consider using these techniques to make your plots more informative and visually appealing.