Using Matplotlib to Limit Colorbar Range
When visualizing data in a matplotlib plot, colorbars are a commonly used tool to represent the range of values in the plot. However, sometimes we may want to limit the range of the colorbar to focus on a specific range of values, rather than the full extent of the data. In this article, we will explore how to limit the colorbar range in matplotlib plots.
Example 1: Basic Colorbar
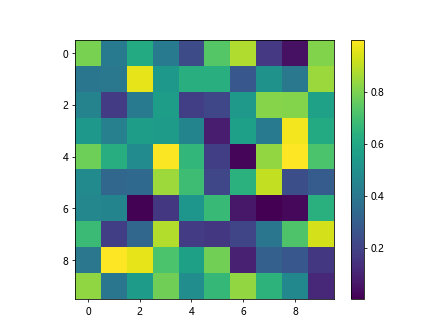
First, let’s start by creating a basic colorbar in a matplotlib plot. We will use the imshow function to create a simple heatmap plot along with a colorbar to represent the range of values.
import numpy as np
import matplotlib.pyplot as plt

data = np.random.rand(10, 10)

plt.imshow(data, cmap='viridis')
plt.colorbar()
plt.show()
Output:

Example 2: Setting Colorbar Limits
To limit the range of the colorbar, we can use the set_clim method on the colorbar object. This allows us to specify the minimum and maximum values displayed on the colorbar.
import numpy as np
import matplotlib.pyplot as plt

data = np.random.rand(10, 10)

plt.imshow(data, cmap='viridis')
cbar = plt.colorbar()
cbar.set_clim(0.2, 0.8)
plt.show()
Example 3: Custom Colorbar Ticks
We can also customize the ticks on the colorbar to match the limited range we have set. This can be done using the set_ticks method on the colorbar object.
import numpy as np
import matplotlib.pyplot as plt

data = np.random.rand(10, 10)

plt.imshow(data, cmap='viridis')
cbar = plt.colorbar()
cbar.set_clim(0.2, 0.8)
cbar.set_ticks([0.2, 0.4, 0.6, 0.8])
plt.show()
Example 4: Continuous Colorbar
In some cases, we may want the colorbar to have a continuous gradient instead of discrete ticks. We can achieve this by using the locator and formatter functions from matplotlib.
import numpy as np
import matplotlib.pyplot as plt
import matplotlib.ticker as ticker

data = np.random.rand(10, 10)

plt.imshow(data, cmap='viridis')
cbar = plt.colorbar()
cbar.set_clim(0.2, 0.8)
cbar.locator = ticker.MaxNLocator(nbins=5)
cbar.formatter = ticker.ScalarFormatter()
plt.show()
Example 5: Symmetric Colorbar
If we want to limit the colorbar range symmetrically around zero, we can use the SymmetricalNormalize function from matplotlib.
import numpy as np
import matplotlib.pyplot as plt
import matplotlib.colors as colors

data = np.random.randn(10, 10)

plt.imshow(data, cmap='coolwarm', norm=colors.SymmetricalNormalize(vmin=-2, vmax=2))
plt.colorbar()
plt.show()
Example 6: Discrete Colorbar
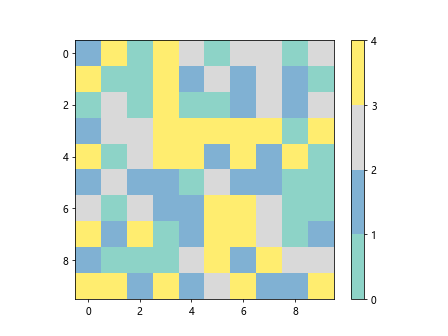
For discrete colorbars with a limited range, we can use the BoundaryNorm function from matplotlib to define specific boundaries for the colors.
import numpy as np
import matplotlib.pyplot as plt
import matplotlib.colors as colors

data = np.random.randint(0, 5, (10, 10))

cmap = plt.get_cmap('Set3', 4)
norm = colors.BoundaryNorm([0, 1, 2, 3, 4], cmap.N)

plt.imshow(data, cmap=cmap, norm=norm)
plt.colorbar()
plt.show()
Output:

Example 7: Logarithmic Colorbar
If our data spans multiple orders of magnitude, we may want to use a logarithmic colorbar with a limited range. This can be achieved by setting a logarithmic scale for the colorbar.
import numpy as np
import matplotlib.pyplot as plt

data = 10 + np.logspace(0, 3, 100)

plt.plot(data)
plt.yscale('log')
plt.colorbar()
plt.show()
Example 8: Custom Colorbar Levels
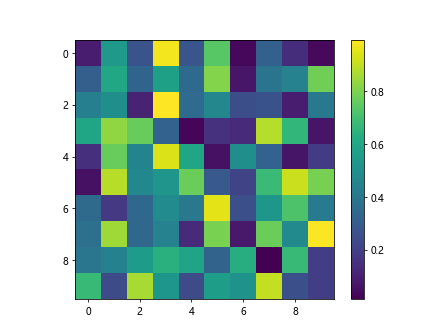
In some cases, we may want to specify custom levels for the colorbar. This can be done using the set_ticks method, but with a list of values as the input.
import numpy as np
import matplotlib.pyplot as plt

data = np.random.rand(10, 10)

plt.imshow(data, cmap='viridis')
cbar = plt.colorbar()
cbar.set_ticks([0.2, 0.4, 0.6, 0.8])
plt.show()
Output:

Example 9: Reversed Colorbar
If we want to reverse the colorbar, we can simply use the invert_yaxis method on the colorbar object.
import numpy as np
import matplotlib.pyplot as plt

data = np.random.rand(10, 10)

plt.imshow(data, cmap='viridis')
cbar = plt.colorbar()
cbar.invert_yaxis()
plt.show()
Example 10: Colorbar Orientation
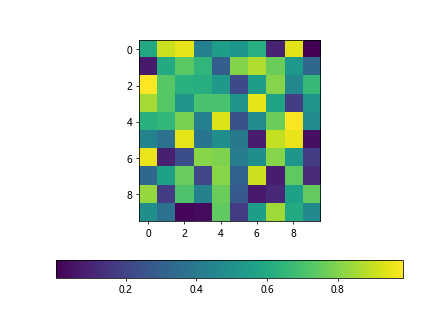
We can also change the orientation of the colorbar by setting the orientation parameter when creating the colorbar.
import numpy as np
import matplotlib.pyplot as plt

data = np.random.rand(10, 10)

plt.imshow(data, cmap='viridis')
plt.colorbar(orientation='horizontal')
plt.show()
Output:

In conclusion, matplotlib offers a wide range of options for limiting the colorbar range in plots. By using the methods and functions provided by matplotlib, we can customize the colorbar to better represent our data and focus on specific ranges of values. Experimenting with these examples will help you create more informative and visually appealing plots in your data analysis projects.