Using gridspec_kw in Matplotlib
When creating complex layouts in Matplotlib, it is often necessary to have more control over the arrangement of subplots. This is where gridspec_kw comes in handy. gridspec_kw is a dictionary of keyword arguments that can be passed to the GridSpec class constructor to customize the layout of subplots in a grid.
Creating a simple grid of subplots
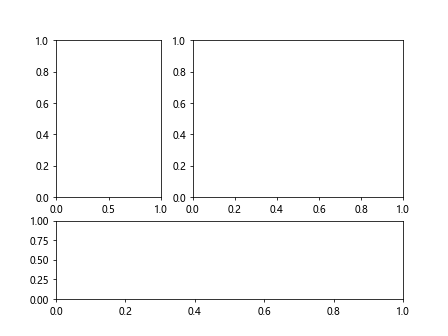
To begin, let’s create a simple grid of subplots using gridspec_kw. In this example, we will create a 2×2 grid of subplots.
import matplotlib.pyplot as plt

fig = plt.figure()
gs = fig.add_gridspec(nrows=2, ncols=2, gridspec_kw={'hspace': 0.5, 'wspace': 0.2})

ax1 = fig.add_subplot(gs[0, 0])
ax2 = fig.add_subplot(gs[0, 1])
ax3 = fig.add_subplot(gs[1, 0])
ax4 = fig.add_subplot(gs[1, 1])

plt.show()
In this code snippet, we create a 2×2 grid of subplots with some horizontal spacing (hspace) and vertical spacing (wspace) between the subplots.
Adjusting subplot sizes
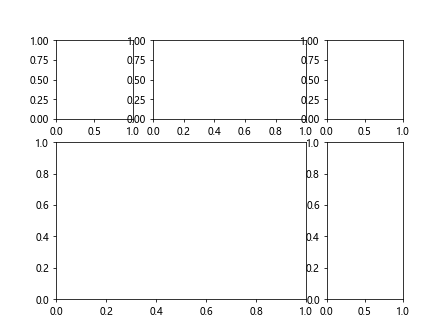
Another useful feature of gridspec_kw is the ability to adjust the sizes of subplots in a grid. Let’s see an example of how we can create subplots with different aspect ratios.
import matplotlib.pyplot as plt

fig = plt.figure()
gs = fig.add_gridspec(nrows=2, ncols=2, width_ratios=[1, 2], height_ratios=[2, 1])

ax1 = fig.add_subplot(gs[0, 0])
ax2 = fig.add_subplot(gs[0, 1])
ax3 = fig.add_subplot(gs[1, :])

plt.show()
Output:
In this code snippet, we create a 2×2 grid of subplots where the first column is twice as wide as the second column, and the first row is twice as tall as the second row.
Combining different subplot arrangements
gridspec_kw allows us to combine different subplot arrangements within the same grid. Let’s see an example of how we can create a grid with different column widths and row heights.
import matplotlib.pyplot as plt

fig = plt.figure()
gs = fig.add_gridspec(nrows=2, ncols=3, width_ratios=[1, 2, 1], height_ratios=[1, 2])

ax1 = fig.add_subplot(gs[0, 0])
ax2 = fig.add_subplot(gs[0, 1])
ax3 = fig.add_subplot(gs[0, 2])
ax4 = fig.add_subplot(gs[1, :2])
ax5 = fig.add_subplot(gs[1, 2])

plt.show()
Output:
In this code snippet, we create a 2×3 grid of subplots with different column widths and row heights, resulting in a more complex layout.
Setting subplot locations
Besides adjusting the sizes of subplots, gridspec_kw allows us to control the location of subplots within a grid. Let’s see an example of how we can create a custom layout with subplots at specific positions.
import matplotlib.pyplot as plt

fig = plt.figure()
gs = fig.add_gridspec(nrows=3, ncols=3)

ax1 = fig.add_subplot(gs[:2, :2])
ax2 = fig.add_subplot(gs[:2, 2])
ax3 = fig.add_subplot(gs[2, :])

plt.show()
Output:
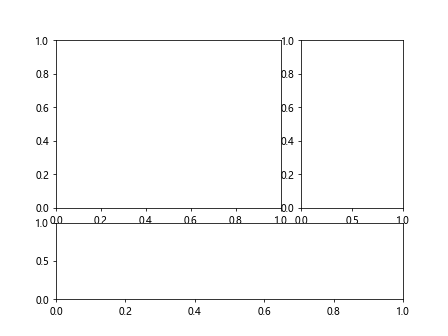
In this code snippet, we create a 3×3 grid of subplots with the first subplot spanning the first two rows and columns, the second subplot at the top right corner, and the third subplot at the bottom row.
Nesting gridspecs
One powerful feature of gridspec_kw is the ability to nest grids within grids to create even more complex layouts. Let’s see an example of how we can nest gridspecs to create a highly customized layout.
import matplotlib.pyplot as plt

fig = plt.figure()
outer_gs = fig.add_gridspec(nrows=3, ncols=3)

ax1 = fig.add_subplot(outer_gs[0, :])
inner_gs = outer_gs[1:, 0].subgridspec(2, 2)
ax2 = fig.add_subplot(inner_gs[0, 0])
ax3 = fig.add_subplot(inner_gs[0, 1])
ax4 = fig.add_subplot(inner_gs[1, :])

plt.show()
Output:
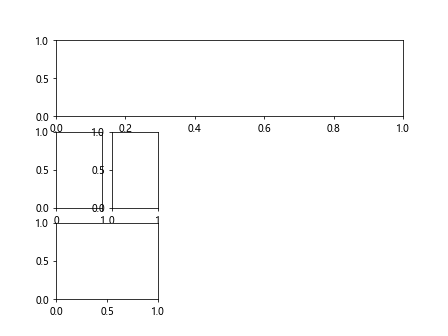
In this code snippet, we create a 3×3 grid of subplots where the first subplot spans the entire top row, and the rest of the subplots are organized in a 2×2 grid nested within the larger grid.
Adding annotations to subplots
gridspec_kw can also be used to add annotations to subplots, such as titles, labels, and legends. Let’s see an example of how we can add annotations to subplots in a grid.
import matplotlib.pyplot as plt

fig = plt.figure()
gs = fig.add_gridspec(nrows=1, ncols=2)

ax1 = fig.add_subplot(gs[0])
ax2 = fig.add_subplot(gs[1])

ax1.plot([1, 2, 3], [3, 2, 1])
ax1.set_title('Plot 1')

ax2.plot([1, 2, 3], [1, 2, 3])
ax2.set_title('Plot 2')

plt.show()
Output:
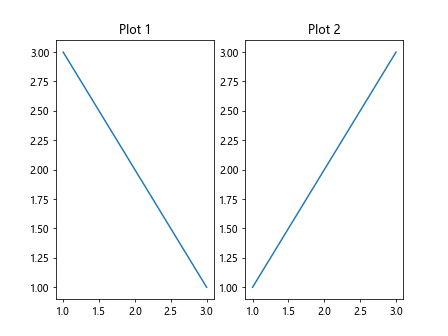
In this code snippet, we create a 1×2 grid of subplots with different plots in each subplot and titles added to each subplot.
Customizing subplot properties
Using gridspec_kw, we can customize various properties of subplots, such as colors, markers, and line styles. Let’s see an example of how we can create subplots with different styles.
import matplotlib.pyplot as plt

fig = plt.figure()
gs = fig.add_gridspec(nrows=1, ncols=2)

ax1 = fig.add_subplot(gs[0])
ax2 = fig.add_subplot(gs[1])

ax1.plot([1, 2, 3], [3, 2, 1], color='blue', marker='o', linestyle='--')
ax1.set_title('Plot 1')

ax2.plot([1, 2, 3], [1, 2, 3], color='red', marker='x', linestyle='-.')
ax2.set_title('Plot 2')

plt.show()
Output:
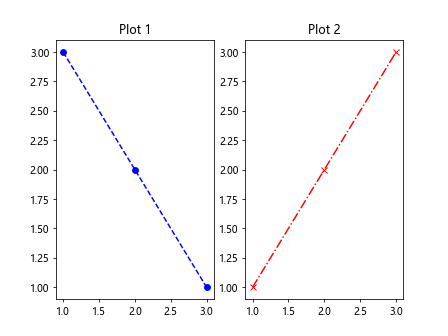
In this code snippet, we create a 1×2 grid of subplots with different line colors, markers, and styles for each plot.
Combining different plot types
gridspec_kw can also be used to combine different types of plots within the same grid. Let’s see an example of how we can create a grid with a line plot and a scatter plot.
import matplotlib.pyplot as plt

fig = plt.figure()
gs = fig.add_gridspec(nrows=1, ncols=2)

ax1 = fig.add_subplot(gs[0])
ax2 = fig.add_subplot(gs[1])

ax1.plot([1, 2, 3], [3, 2, 1], color='blue', marker='o', linestyle='--')
ax1.set_title('Line Plot')

ax2.scatter([1, 2, 3], [1, 2, 3], color='red', marker='x')
ax2.set_title('Scatter Plot')

plt.show()
Output:
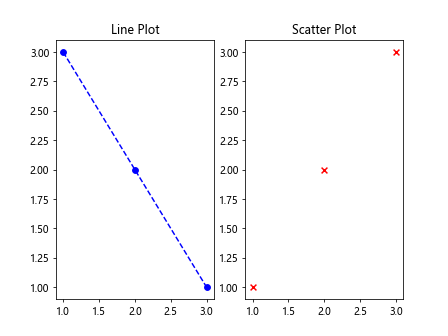
In this code snippet, we create a 1×2 grid of subplots with a line plot in the first subplot and a scatter plot in the second subplot.
Creating multiple grids
With gridspec_kw, we can create multiple grids of subplots within the same figure. Let’s see an example of how we can create two separate grids of subplots.
import matplotlib.pyplot as plt

fig = plt.figure()
gs1 = fig.add_gridspec(nrows=2, ncols=2)
gs2 = fig.add_gridspec(nrows=1, ncols=3)

ax1 = fig.add_subplot(gs1[0, 0])
ax2 = fig.add_subplot(gs1[0, 1])
ax3 = fig.add_subplot(gs1[1, 0])
ax4 = fig.add_subplot(gs1[1, 1])

ax5 = fig.add_subplot(gs2[0, 0])
ax6 = fig.add_subplot(gs2[0, 1:])
ax5.set_title('Grid 2, Plot 1')
ax6.set_title('Grid 2, Plot 2 & 3')

plt.show()
Output:
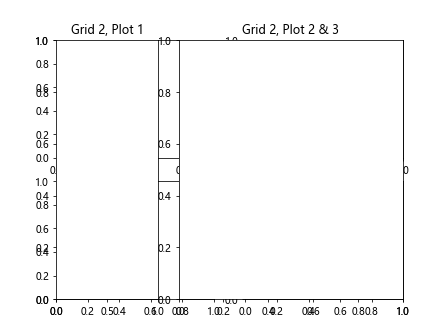
In this code snippet, we create two separate grids of subplots, one with a 2×2 layout and the other with a 1×3 layout, each containing different subplots.
Responsiveness with gridspec_kw
gridspec_kw can also be used to create responsive layouts that adapt to different screen sizes. Let’s see an example of how we can create a grid of subplots that adjusts its size based on the available space.
import matplotlib.pyplot as plt

fig = plt.figure()
gs = fig.add_gridspec(nrows=1, ncols=2, width_ratios=[1, 2])

ax1 = fig.add_subplot(gs[0])
ax2 = fig.add_subplot(gs[1])

ax1.plot([1, 2, 3], [3, 2, 1])
ax1.set_title('Plot 1')

ax2.plot([1, 2, 3, 4, 5], [1, 2, 3, 4, 5])
ax2.set_title('Plot 2')

plt.show()
Output:
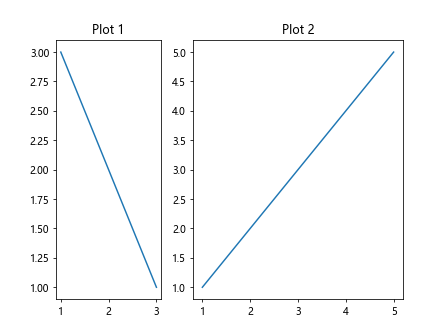
In this code snippet, we create a 1×2 grid of subplots with different width ratios to make the layout responsive to different screen sizes.
Conclusion
In this article, we have explored the use of gridspec_kw in Matplotlib to create customizable grid layouts of subplots. We have seen how gridspec_kw allows us to adjust subplot sizes, locations, annotations, styles, and types within a grid. By leveraging the flexibility of gridspec_kw, we can create complex and responsive layouts for our data visualizations. I hope this article has been helpful in understanding how to make the most of gridspec_kw in Matplotlib.