Adding Title to Matplotlib Figure
Matplotlib is a popular Python library used for creating static, animated, and interactive visualizations in Python. One common requirement when creating a figure using Matplotlib is to add a title to the figure. In this article, we will explore different ways to add a title to a Matplotlib figure.
Adding a Basic Title to a Figure
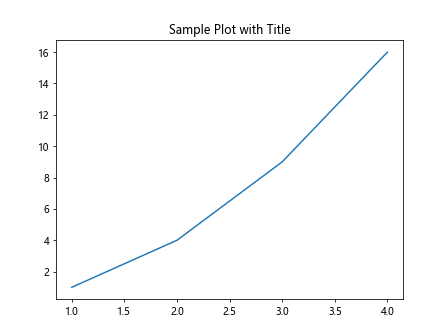
The simplest way to add a title to a Matplotlib figure is by using the plt.title() function. This function takes the title string as an argument and adds it to the figure.
import matplotlib.pyplot as plt

# Create a basic plot
plt.plot([1, 2, 3, 4], [1, 4, 9, 16])

# Add a title to the figure
plt.title('Sample Plot with Title')

plt.show()
Output:
Adding Customized Titles to a Figure
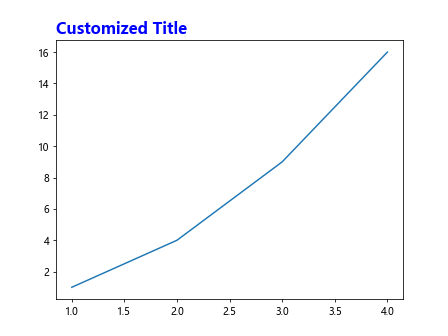
You can further customize the title by changing its font size, font weight, color, and alignment using additional parameters in the plt.title() function.
import matplotlib.pyplot as plt

# Create a basic plot
plt.plot([1, 2, 3, 4], [1, 4, 9, 16])

# Add a customized title to the figure
plt.title('Customized Title', fontsize=16, fontweight='bold', color='blue', loc='left')

plt.show()
Output:
Adding Multiple Titles to a Figure
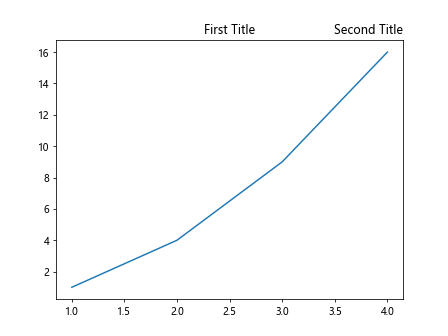
If you need to add multiple titles to a single figure, you can achieve this by calling the plt.title() function multiple times.
import matplotlib.pyplot as plt

# Create a basic plot
plt.plot([1, 2, 3, 4], [1, 4, 9, 16])

# Add multiple titles to the figure
plt.title('First Title')
plt.title('Second Title', loc='right')

plt.show()
Output:
Adding Titles to Subplots
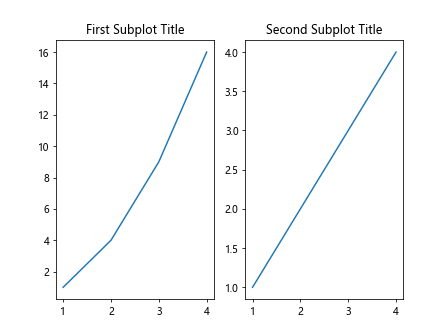
When working with multiple subplots, you can add titles to each subplot individually using the set_title() function.
import matplotlib.pyplot as plt

# Create two subplots
fig, axs = plt.subplots(1, 2)

# Plot on the first subplot
axs[0].plot([1, 2, 3, 4], [1, 4, 9, 16])
axs[0].set_title('First Subplot Title')

# Plot on the second subplot
axs[1].plot([1, 2, 3, 4], [1, 2, 3, 4])
axs[1].set_title('Second Subplot Title')

plt.show()
Output:
Adding Titles to Axes
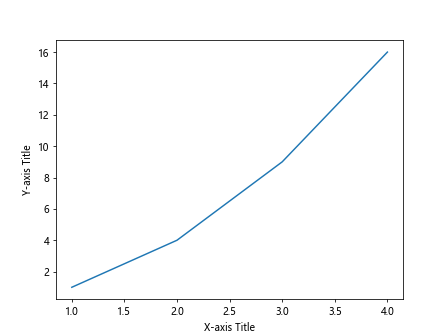
You can also add titles to the X-axis and Y-axis of a plot using the plt.xlabel() and plt.ylabel() functions.
import matplotlib.pyplot as plt

# Create a basic plot
plt.plot([1, 2, 3, 4], [1, 4, 9, 16])

# Add titles to X-axis and Y-axis
plt.xlabel('X-axis Title')
plt.ylabel('Y-axis Title')

plt.show()
Output:
Adding Titles with LaTeX Formatting
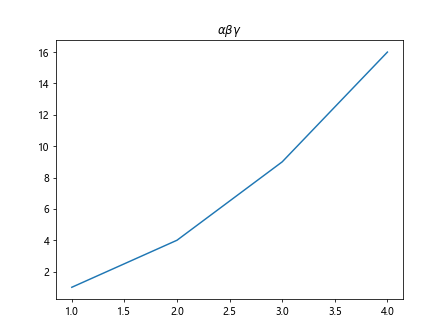
Matplotlib supports LaTeX formatting for text, allowing you to use LaTeX commands to style titles.
import matplotlib.pyplot as plt

# Create a basic plot
plt.plot([1, 2, 3, 4], [1, 4, 9, 16])

# Add a title with LaTeX formatting
plt.title(r'$\alpha \beta \gamma$', fontsize=12)

plt.show()
Output:
Adding Titles to Specific Axes
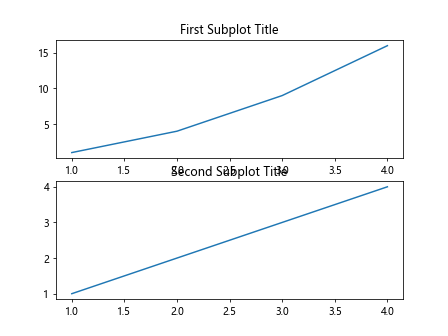
If you have a plot with multiple axes, you can add titles to specific axes using the set_title() function on the axes object.
import matplotlib.pyplot as plt

# Create a figure with two subplots
fig, axs = plt.subplots(2)

# Plot on the first subplot
axs[0].plot([1, 2, 3, 4], [1, 4, 9, 16])
axs[0].set_title('First Subplot Title')

# Plot on the second subplot
axs[1].plot([1, 2, 3, 4], [1, 2, 3, 4])
axs[1].set_title('Second Subplot Title')

plt.show()
Output:
Adding Titles to Specific Subplots
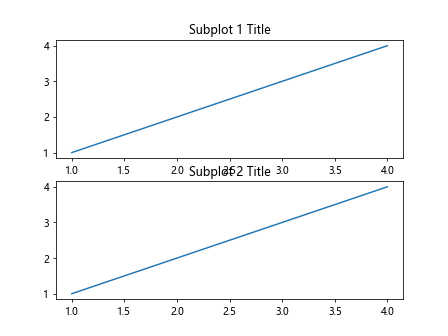
If you want to add different titles to different subplots within a single figure, you can iterate over the axes objects and set titles individually.
import matplotlib.pyplot as plt

# Create a figure with two subplots
fig, axs = plt.subplots(2)

# Iterate over the axes and set titles
for i, ax in enumerate(axs):
    ax.plot([1, 2, 3, 4], [1, 2, 3, 4])
    ax.set_title(f'Subplot {i+1} Title')

plt.show()
Output:
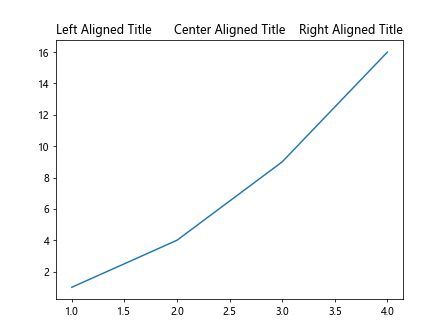
Adding Titles with Different Alignments
You can specify the alignment of the title text within the figure using the loc parameter in the plt.title() function.
import matplotlib.pyplot as plt

# Create a basic plot
plt.plot([1, 2, 3, 4], [1, 4, 9, 16])

# Add titles with different alignments to the figure
plt.title('Left Aligned Title', loc='left')
plt.title('Center Aligned Title', loc='center')
plt.title('Right Aligned Title', loc='right')

plt.show()
Output:
Conclusion
In this article, we explored various ways to add titles to Matplotlib figures. From basic titles to customized titles, and from titles on subplots to titles on axes, there are many options available for adding informative and visually appealing titles to your plots. By using the techniques and examples provided in this article, you can effectively enhance the presentation of your visualizations with Matplotlib.