Matplotlib Axis Label Size
Matplotlib is a popular Python library that is widely used for creating various types of plots and visualizations. One common customization that you may want to make when creating plots using Matplotlib is adjusting the size of the axis labels. In this article, we will explore how to change the size of the axis labels in Matplotlib.
Setting the Axis Label Size
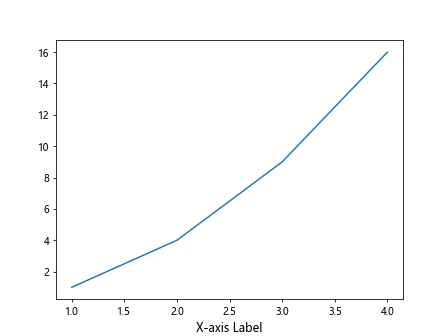
You can easily set the size of the axis labels in Matplotlib by accessing the fontsize property of the xlabel and ylabel methods. Here is an example code snippet that demonstrates how to set the size of the x-axis label:
import matplotlib.pyplot as plt

plt.plot([1, 2, 3, 4], [1, 4, 9, 16])
plt.xlabel('X-axis Label', fontsize=12) # set the font size to 12
plt.show()
Output:
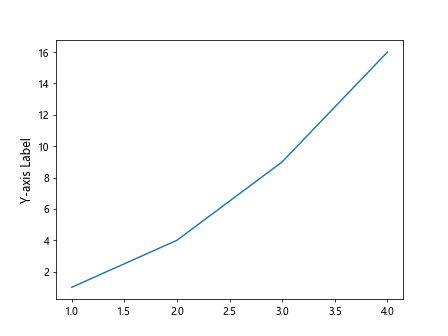
Similarly, you can set the size of the y-axis label using the fontsize parameter in the ylabel method. Here is an example code snippet:
import matplotlib.pyplot as plt

plt.plot([1, 2, 3, 4], [1, 4, 9, 16])
plt.ylabel('Y-axis Label', fontsize=12) # set the font size to 12
plt.show()
Output:
Changing the Axis Label Size for Subplots
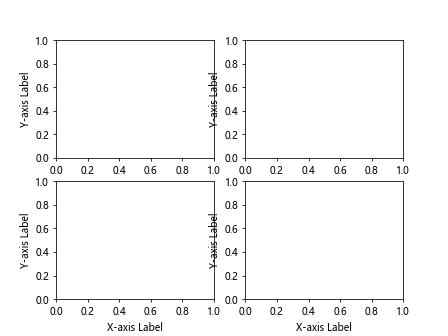
If you are working with subplots in Matplotlib, you can adjust the size of the axis labels for each subplot individually. To do this, you need to set the font size for the x-axis and y-axis labels for each subplot separately. Here is an example code snippet that demonstrates how to change the size of the axis labels for multiple subplots:
import matplotlib.pyplot as plt

# Create a figure with multiple subplots
fig, axs = plt.subplots(2, 2)

# Set the font size for the x-axis label in each subplot
for i in range(2):
    for j in range(2):
        axs[i, j].set_xlabel('X-axis Label', fontsize=10)

# Set the font size for the y-axis label in each subplot
for i in range(2):
    for j in range(2):
        axs[i, j].set_ylabel('Y-axis Label', fontsize=10)

plt.show()
Output:
Customizing Axis Label Size Using rcParams
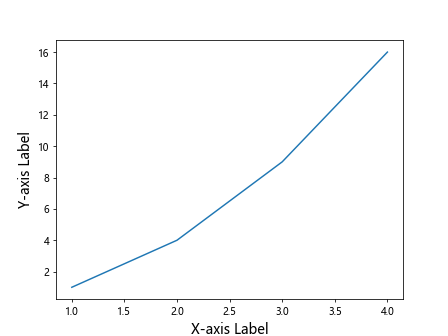
Another way to customize the axis label size in Matplotlib is by updating the rcParams dictionary. This method allows you to set the default font size for all plots in your script. Here is an example code snippet that demonstrates how to change the default size of the axis labels using rcParams:
import matplotlib.pyplot as plt
import matplotlib as mpl

# Update the rcParams dictionary to change the default font size
mpl.rcParams['axes.labelsize'] = 14

plt.plot([1, 2, 3, 4], [1, 4, 9, 16])
plt.xlabel('X-axis Label') # the font size will be 14
plt.ylabel('Y-axis Label') # the font size will be 14
plt.show()
Output:
Adjusting Axis Label Size with Tick Parameters
In addition to setting the font size directly in the xlabel and ylabel methods, you can also adjust the size of the axis labels using the tick_params method. By specifying the labelsize parameter, you can control the size of the axis labels. Here is an example code snippet that demonstrates how to change the axis label size using tick_params:
import matplotlib.pyplot as plt

plt.plot([1, 2, 3, 4], [1, 4, 9, 16])
plt.xlabel('X-axis Label') # default font size
plt.ylabel('Y-axis Label') # default font size

plt.tick_params(axis='x', labelsize=14) # set the x-axis label font size to 14
plt.tick_params(axis='y', labelsize=14) # set the y-axis label font size to 14

plt.show()
Output:
Conclusion
In this article, we have explored various ways to adjust the size of the axis labels in Matplotlib plots. By using the methods and techniques discussed here, you can customize the appearance of your plots and create visually appealing visualizations. Experiment with different font sizes and styles to find the best configuration for your plots. I hope this guide has been helpful in enhancing your data visualization skills with Matplotlib.
Remember, practice makes perfect, so don’t hesitate to try out different customization options and create stunning visualizations that effectively communicate your data insights.