Matplotlib Axis Labels
In this article, we will explore how to add axis labels to plots created using Matplotlib.
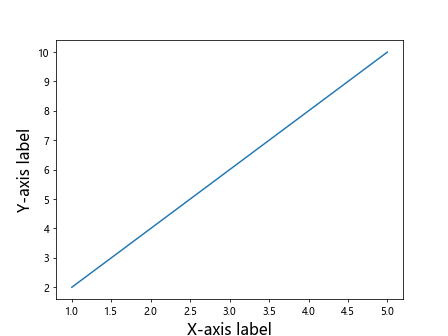
1. Basic usage of axis labels
import matplotlib.pyplot as plt

x = [1, 2, 3, 4, 5]
y = [2, 4, 6, 8, 10]

plt.plot(x, y)
plt.xlabel('X-axis label')
plt.ylabel('Y-axis label')
plt.show()
Output:

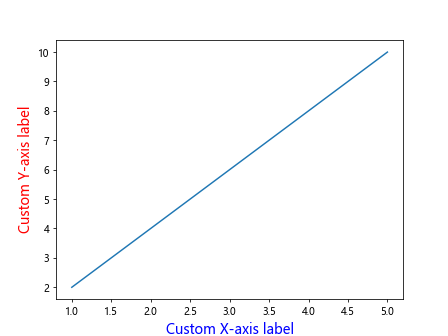
2. Customizing axis labels
import matplotlib.pyplot as plt

x = [1, 2, 3, 4, 5]
y = [2, 4, 6, 8, 10]

plt.plot(x, y)
plt.xlabel('Custom X-axis label', color='blue', fontsize=14)
plt.ylabel('Custom Y-axis label', color='red', fontsize=14)
plt.show()
Output:
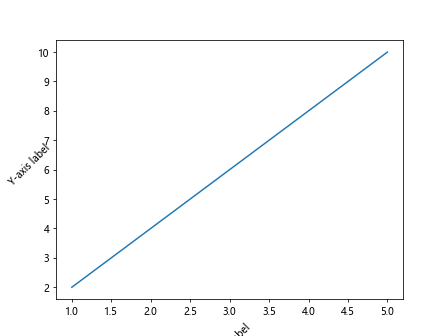
3. Rotating axis labels
import matplotlib.pyplot as plt

x = [1, 2, 3, 4, 5]
y = [2, 4, 6, 8, 10]

plt.plot(x, y)
plt.xlabel('X-axis label', rotation=45)
plt.ylabel('Y-axis label', rotation=45)
plt.show()
Output:
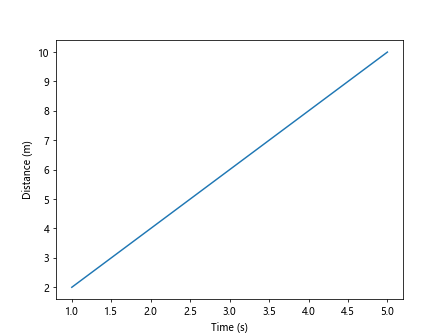
4. Adding units to axis labels
import matplotlib.pyplot as plt

x = [1, 2, 3, 4, 5]
y = [2, 4, 6, 8, 10]

plt.plot(x, y)
plt.xlabel('Time (s)')
plt.ylabel('Distance (m)')
plt.show()
Output:
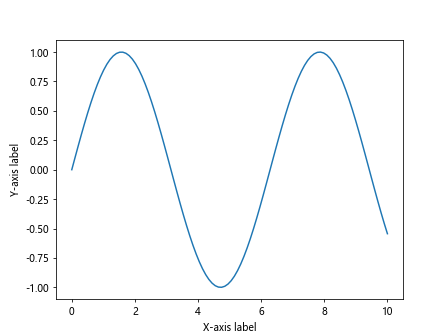
5. Formatting axis labels
import matplotlib.pyplot as plt
import numpy as np

x = np.linspace(0, 10, 100)
y = np.sin(x)

plt.plot(x, y)
plt.xlabel('X-axis label', style='italic')
plt.ylabel('Y-axis label', style='italic')
plt.show()
Output:
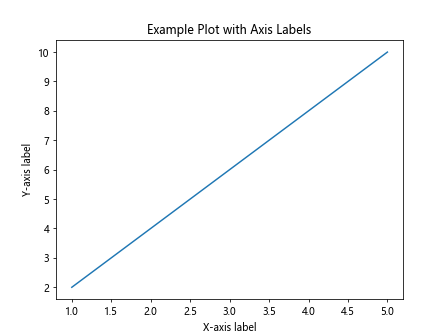
6. Adding a title to axis labels
import matplotlib.pyplot as plt

x = [1, 2, 3, 4, 5]
y = [2, 4, 6, 8, 10]

plt.plot(x, y)
plt.xlabel('X-axis label')
plt.ylabel('Y-axis label')
plt.title('Example Plot with Axis Labels')
plt.show()
Output:
7. Changing the font style of axis labels
import matplotlib.pyplot as plt

x = [1, 2, 3, 4, 5]
y = [2, 4, 6, 8, 10]

plt.plot(x, y)
plt.xlabel('X-axis label', fontstyle='italic')
plt.ylabel('Y-axis label', fontstyle='italic')
plt.show()
Output:
8. Adjusting the position of axis labels
import matplotlib.pyplot as plt

x = [1, 2, 3, 4, 5]
y = [2, 4, 6, 8, 10]

plt.plot(x, y)
plt.xlabel('X-axis label', x=0.5)
plt.ylabel('Y-axis label', y=0.5)
plt.show()
Output:

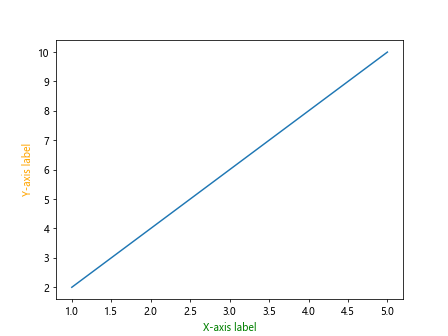
9. Changing the color of axis labels
import matplotlib.pyplot as plt

x = [1, 2, 3, 4, 5]
y = [2, 4, 6, 8, 10]

plt.plot(x, y)
plt.xlabel('X-axis label', color='green')
plt.ylabel('Y-axis label', color='orange')
plt.show()
Output:
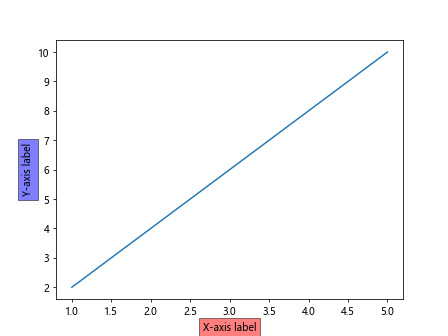
10. Adding a border to axis labels
import matplotlib.pyplot as plt

x = [1, 2, 3, 4, 5]
y = [2, 4, 6, 8, 10]

plt.plot(x, y)
plt.xlabel('X-axis label', bbox=dict(facecolor='red', alpha=0.5))
plt.ylabel('Y-axis label', bbox=dict(facecolor='blue', alpha=0.5))
plt.show()
Output:
11. Changing the font size of axis labels
import matplotlib.pyplot as plt

x = [1, 2, 3, 4, 5]
y = [2, 4, 6, 8, 10]

plt.plot(x, y)
plt.xlabel('X-axis label', fontsize=16)
plt.ylabel('Y-axis label', fontsize=16)
plt.show()
Output:
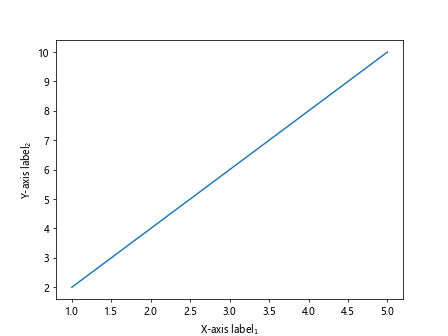
12. Adding subscript to axis labels
import matplotlib.pyplot as plt

x = [1, 2, 3, 4, 5]
y = [2, 4, 6, 8, 10]

plt.plot(x, y)
plt.xlabel('X-axis label$_1$')
plt.ylabel('Y-axis label$_2$')
plt.show()
Output:
13. Adding superscript to axis labels
import matplotlib.pyplot as plt

x = [1, 2, 3, 4, 5]
y = [2, 4, 6, 8, 10]

plt.plot(x, y)
plt.xlabel('X-axis label$^1$')
plt.ylabel('Y-axis label$^2$')
plt.show()
Output:

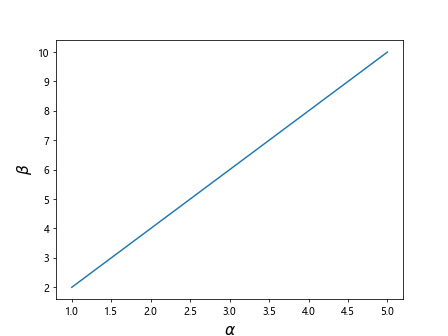
14. Using LaTeX in axis labels
import matplotlib.pyplot as plt

x = [1, 2, 3, 4, 5]
y = [2, 4, 6, 8, 10]

plt.plot(x, y)
plt.xlabel(r'$\alpha$', fontsize=16)
plt.ylabel(r'$\beta$', fontsize=16)
plt.show()
Output:
15. Adding symbols to axis labels
import matplotlib.pyplot as plt

x = [1, 2, 3, 4, 5]
y = [2, 4, 6, 8, 10]

plt.plot(x, y)
plt.xlabel('X-axis label \u03B1')
plt.ylabel('Y-axis label \u03B2')
plt.show()
Output:

16. Using subscript and superscript together in axis labels
import matplotlib.pyplot as plt

x = [1, 2, 3, 4, 5]
y = [2, 4, 6, 8, 10]

plt.plot(x, y)
plt.xlabel('X-axis label$_1^2$')
plt.ylabel('Y-axis label$_2^2$')
plt.show()
Output:

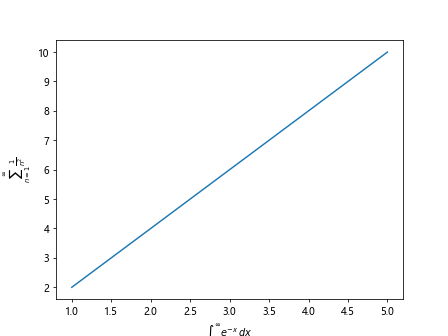
17. Adding math equations to axis labels
import matplotlib.pyplot as plt

x = [1, 2, 3, 4, 5]
y = [2, 4, 6, 8, 10]

plt.plot(x, y)
plt.xlabel(r'$\int_0^{\infty} e^{-x} \,dx$')
plt.ylabel(r'$\sum_{n=1}^{\infty} \frac{1}{n^2}$')
plt.show()
Output:
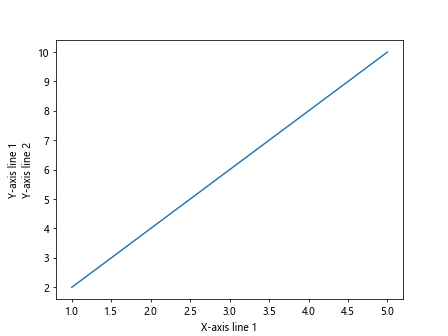
18. Adding multiple lines to axis labels
import matplotlib.pyplot as plt

x = [1, 2, 3, 4, 5]
y = [2, 4, 6, 8, 10]

plt.plot(x, y)
plt.xlabel('X-axis line 1\nX-axis line 2')
plt.ylabel('Y-axis line 1\nY-axis line 2')
plt.show()
Output:
19. Adding special characters to axis labels
import matplotlib.pyplot as plt

x = [1, 2, 3, 4, 5]
y = [2, 4, 6, 8, 10]

plt.plot(x, y)
plt.xlabel('X-axis label $\u20AC$')
plt.ylabel('Y-axis label $\u00A2$')
plt.show()
Output:

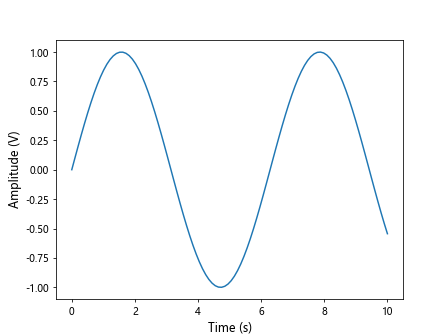
20. Adding units with formatting to axis labels
import matplotlib.pyplot as plt
import numpy as np

x = np.linspace(0, 10, 100)
y = np.sin(x)

plt.plot(x, y)
plt.xlabel('Time (s)', fontsize=12)
plt.ylabel('Amplitude (V)', fontsize=12)
plt.show()
Output:
Conclusion
In this article, we have explored various ways to customize and add axis labels to plots created using Matplotlib. By adjusting the style, position, color, font size, and content of the axis labels, we can make our plots more informative and visually appealing. Experiment with the provided examples to create visually stunning plots with customized axis labels.