Matplotlib Axis Font Size
Matplotlib is a popular data visualization library in Python that allows you to create a wide range of plots and graphs. One common customization that users often want to apply is adjusting the font size of the axis labels. In this article, we will explore how to change the font size of axis labels in Matplotlib.
Setting the Font Size for Axis Labels
You can set the font size for axis labels in Matplotlib by using the fontsize parameter in the set_ylabel() and set_xlabel() methods. Let’s see how you can do this:
import matplotlib.pyplot as plt

plt.plot([1, 2, 3, 4], [1, 4, 9, 16])
plt.xlabel('X-axis Label', fontsize=12)
plt.ylabel('Y-axis Label', fontsize=12)
plt.show()
Output:
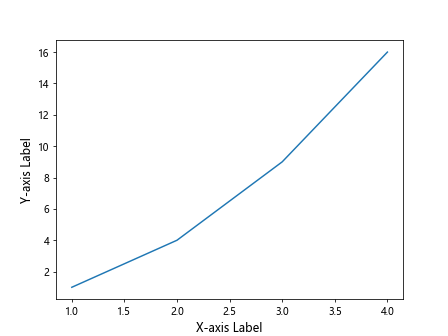
In the example above, we set the font size of the X-axis and Y-axis labels to 12 using the fontsize parameter.
Changing the Font Size of Tick Labels
You can also adjust the font size of tick labels on the axes in Matplotlib. This can be done by setting the fontsize parameter in the xticks() and yticks() methods. Here’s an example:
import matplotlib.pyplot as plt

plt.plot([1, 2, 3, 4], [1, 4, 9, 16])
plt.xticks(fontsize=10)
plt.yticks(fontsize=10)
plt.show()
Output:
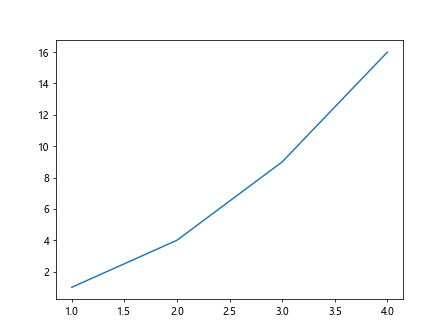
In the code snippet above, we set the font size of the tick labels on both the X-axis and Y-axis to 10.
Changing the Font Size of the Title
In addition to the axis labels and tick labels, you can also adjust the font size of the plot title in Matplotlib. This can be done by using the fontsize parameter in the set_title() method. Here’s an example:
import matplotlib.pyplot as plt

plt.plot([1, 2, 3, 4], [1, 4, 9, 16])
plt.title('Title of the Plot', fontsize=14)
plt.show()
Output:
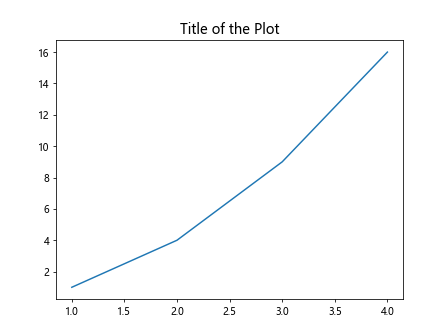
In the example above, we set the font size of the plot title to 14 using the fontsize parameter.
Changing the Font Size of the Legend
If your plot includes a legend, you can adjust the font size of the legend as well. This can be done by using the fontsize parameter in the legend() method. Let’s take a look at how you can do this:
import matplotlib.pyplot as plt

plt.plot([1, 2, 3, 4], [1, 4, 9, 16], label='Line 1')
plt.legend(fontsize=12)
plt.show()
Output:
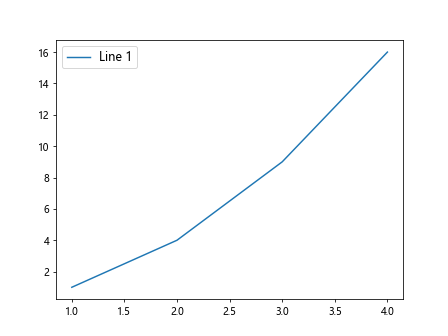
In the code snippet above, we set the font size of the legend to 12 using the fontsize parameter.
Customizing Font Size for Multiple Elements
Sometimes you may want to customize the font size for multiple elements in your plot, such as the axis labels, tick labels, title, and legend. You can achieve this by setting the fontsize parameter for each of these elements individually. Here’s an example that demonstrates customizing the font size for multiple elements:
import matplotlib.pyplot as plt

plt.plot([1, 2, 3, 4], [1, 4, 9, 16], label='Line 1')
plt.xlabel('X-axis Label', fontsize=12)
plt.ylabel('Y-axis Label', fontsize=12)
plt.xticks(fontsize=10)
plt.yticks(fontsize=10)
plt.title('Title of the Plot', fontsize=14)
plt.legend(fontsize=12)
plt.show()
Output:
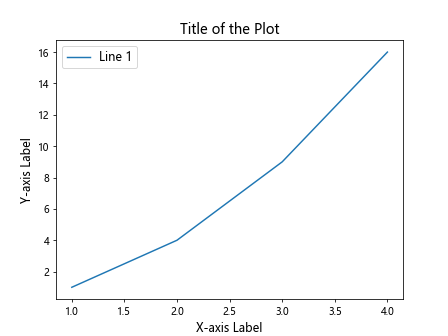
In the example above, we set the font size for the X-axis label, Y-axis label, tick labels on both axes, plot title, and legend.
Changing the Font Size of Specific Axis
In some cases, you may want to adjust the font size of the labels and tick labels for a specific axis only. This can be achieved by specifying the axis object when setting the font size. Let’s see an example of this:
import matplotlib.pyplot as plt

fig, ax = plt.subplots()
ax.plot([1, 2, 3, 4], [1, 4, 9, 16])
ax.set_xlabel('X-axis Label', fontsize=12)
ax.set_ylabel('Y-axis Label', fontsize=12)
ax.tick_params(axis='x', labelsize=10)
ax.tick_params(axis='y', labelsize=10)
plt.show()
Output:
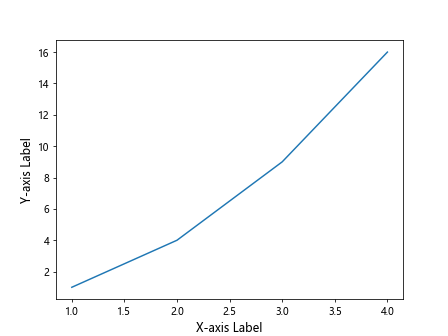
In the code snippet above, we create an axis object using plt.subplots() and set the font size for the X-axis label, Y-axis label, and tick labels on both axes.
Adjusting Font Size Using rcParams
Another way to customize the font size of various elements in a Matplotlib plot is by using rcParams. This allows you to set default values for font sizes across different elements. Let’s see an example of how to adjust the font size using rcParams:
import matplotlib.pyplot as plt
import matplotlib as mpl

mpl.rcParams['font.size'] = 12

plt.plot([1, 2, 3, 4], [1, 4, 9, 16])
plt.xlabel('X-axis Label')
plt.ylabel('Y-axis Label')
plt.show()
Output:
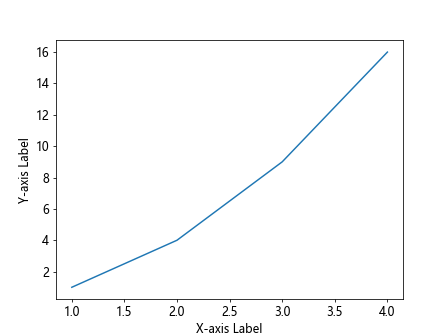
In the code snippet above, we set the default font size to 12 using rcParams['font.size'].
Conclusion
In this article, we explored how to change the font size of axis labels, tick labels, title, and legend in Matplotlib plots. By customizing the font size of these elements, you can create more visually appealing and readable plots. Experiment with different font sizes to find the perfect balance for your plots. I hope this guide has been helpful in understanding how to adjust font sizes in Matplotlib. Happy plotting!